From your first coloured territory to the finished print. Real panels, numbered pointers and plain-English help for the things you can click, drag and change.
The topic list follows the tool, from START HERE to More Maps, then saving and your file manager. Open a topic and match the numbered circles to the explanations beside the picture.
Pictures use example maps and expanded menus. Your available layers, access options and prices can differ. This handbook describes the classic editor; maps marked pro open in VectorMaps.
Find your answer
Search the handbook
Start here
Your first coloured map
A good territory map begins with a few clear names. Give each team, branch or service area its own zone in the legend (also called the key). Click a zone name in the legend to select it, then click inside the shapes on the map that you want to colour for that zone. You can tidy the labels and page layout afterwards.
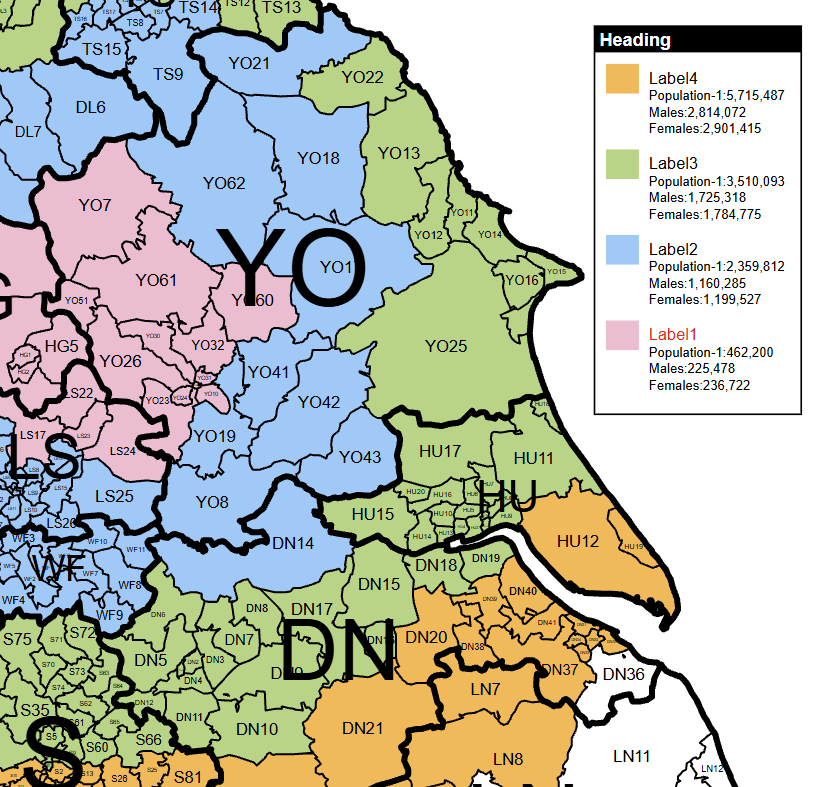
1. Select the zone, then click the map. Click North team’s name in the legend first. Then click inside YO17 on the map itself. The pointer shows the sort of place to click: inside the boundary shape, rather than on a legend colour square or a menu control. 2. See the shape change colour. After that click, YO17 belongs to North team and turns green. Continue clicking the map shapes you want in this zone. You only need to select a new legend name when you want to work on a different zone. 3. Choose the next zone. Select York team in the legend, then click its shapes on the map. They turn blue; the existing North team shapes remain green. If you click a shape already owned by another zone, you move it into the zone you have selected.
Open START HERE and choose Add New Name. Type a useful name such as North team or Leeds depot. The entry appears in the map key as you type. Add one entry for each territory you want people to recognise. The name is a label for your territory; it does not search for or select a place automatically.
Click the zone name in the legend on the map, for example North team. Its name is highlighted to show it is selected. Now move your pointer onto the map itself and click inside each postcode or county shape that belongs to North team. Each shape takes that zone’s colour. Click a different zone name in the legend before colouring the shapes for your next team. You can also select a zone through its name box in START HERE.
Click its colour square to open the palette. Choosing a colour changes that entry and the polygons already assigned to it. Pick colours that remain easy to tell apart when the map is printed.
Use Map details to reduce clutter, Map Titles to describe the job and Key Settings to arrange the key. Check Print View before exporting. Save the editable map as well as downloading the finished image; the editable copy is what you will reopen to change the territories.
Find your way around
Print View, Design & On Google
These tabs show the map in different contexts. Print View and Design work on the same artwork. On Google opens a geographic preview of the territory information.
Shows the page background, title and border, with the map clipped to the page. Use it to judge what will fit on a PDF or image: check the key, markers and any circles near the edges. It is still possible to work on the map here.
Gives you room to work beyond the page edge. The page decorations are hidden and a guide shows the page boundary. It is useful when moving the map or key into place. Anything left outside the final page may be cut off in a download. Switching tabs does not create a second design.
Builds a preview of the current territories over a geographic background. The editing sidebar is hidden and cannot be reopened in this view; it returns to its previous state when you go back to Print View or Design. Undo and Redo are unavailable here. Return to the editor to change the design, then reopen On Google to refresh the preview.
Shows or hides the floating map controls, including the colouring mode, page orientation and navigation buttons. Hiding them makes more room to inspect the artwork; it does not remove map content from a saved file.
Starts the guided introduction to the tool. Follow its on-screen steps, move on with its navigation buttons, or close it to return to your map. The question-mark links beside individual menus take you to the relevant video.
The colourful messages are the standard presentation. Use this control to change the style of prompts without changing what their buttons do. Your choice is remembered in this browser.
Undo reverses a recent colouring operation; Redo restores it. A greyed-out button has no available step, or you are in a view where editing is unavailable. Read any import or delete confirmation rather than assuming the whole tool has unlimited undo.
Enter a postcode or place and use the magnifying-glass button. The search locates it for you; it does not assign it to a territory. The red clear button removes the search indication. Search availability and wording depend on the selected map. The same top search is used in On Google once that preview is ready.
Opens this handbook in a large overlay. Search for an answer or browse the menus, then use the close cross, Back to my map or Escape to resume your work. It is also available in On Google. Help does not save or change the map.
Find your way around
Move, zoom & frame the map
Map movement changes the composition of the artwork on the page. Place the pointer over the map itself when you want to move or zoom the map; the key has its own gestures.
Roll the wheel or use your trackpad’s scroll gesture over the map to change its scale. Zoom in for small districts or sectors, then zoom out to check the overall composition. Double-click also zooms the SVG map, but use the wheel or +/− while colouring to avoid combining quick colouring clicks with a zoom. If the key changes size, move the pointer off the key first.
Press and hold on the map, move the pointer, then release. This moves the map within the page without changing which territory owns a polygon. A quick click is a colouring action, so make a deliberate drag. Switch off Place on map or Place centre on map first if a marker or circle is being repositioned.
Use − to zoom out and + to zoom in. They are useful if your mouse has no wheel or you want an obvious control on a touch screen. Zooming can also change which boundary level is selected for colouring, so keep an eye on Colour:.
Restores the map’s starting scale and position. Use it if you have zoomed too far in, moved the map out of sight, or want to start framing the page again. It does not clear your territory colours. The key has its own Reset position button.
Opens the directional controls. Use the arrows to move the artwork up, down, left or right; holding an arrow continues the movement. The centre button fits the map. Click away or press Escape to close the pad.
Tap a territory name and then a polygon to colour it. Use a deliberate drag to move the map and a two-finger pinch to zoom. The visible +, − and Move map controls are useful when a small polygon or a crowded key makes touch gestures awkward. A placement mode takes priority over ordinary colouring.
Click a menu heading to open its controls; opening another menu closes the previous panel. Use the handle at the side of the sidebar to make more room for the map, then use it again to bring the menus back. In On Google the sidebar is intentionally unavailable.
Find your way around
Portrait, landscape & square pages
Page shape and key layout are separate choices. A landscape page can still have a tall, portrait key.
Gives you a tall page. This often suits a map of Great Britain or a north–south territory. After switching, check the map framing, title and key in Print View.
Gives you a wide page. It can work well for an east–west region or a presentation slide. Move and resize the map and key to make good use of the width.
Uses a square page for a more balanced local map or a square graphic. Check the edges before exporting; changing the page shape does not decide the best composition for you.
Build your map
Colour whole areas or smaller districts
A map can contain a broad boundary layer and a more detailed one. The Colour: control tells you which level a click will affect. The Detail: control describes the map product itself.
2. See the shape change colour. After that click, YO17 belongs to North team and turns green. Continue clicking the map shapes you want in this zone. You only need to select a new legend name when you want to work on a different zone.
On a district or sector map, click Colour: to switch between the available broad and detailed colouring modes. Zooming also changes the automatic mode as you move between an overview and close detail. Always read this label before colouring: seeing small boundaries does not by itself mean a click will affect only one small polygon.
If some smaller polygons already have territory assignments and you try to colour their whole parent area, the tool warns you before replacing that work. Choose Keep existing colours to leave it alone, or Colour whole area to replace the assignments across that area. This also applies when zooming has automatically changed the colouring mode.
If you confirmed the replacement by mistake, use Undo straight away to restore the preceding colouring. To build up a mixed area carefully, switch back to the smaller boundary level and assign the individual districts or sectors instead.
Opens a short explanation of the current boundary detail and a suggested more detailed map, where one exists. The preview/browse link opens another map choice; it is not a switch that adds new geometry to your current saved artwork. Save your current work before leaving.
Build your map
START HERE: names, colours & territories
Each zone in the legend represents a territory, such as a sales team, depot or service area. To build it, click the zone name in the legend, then click the shapes you want to colour on the map itself. Those boundary shapes are sometimes called polygons. You can change the zone’s name or colour later without selecting all its shapes again.
1. Select the zone, then click the map. Click North team’s name in the legend first. Then click inside YO17 on the map itself. The pointer shows the sort of place to click: inside the boundary shape, rather than on a legend colour square or a menu control. 2. See the shape change colour. After that click, YO17 belongs to North team and turns green. Continue clicking the map shapes you want in this zone. You only need to select a new legend name when you want to work on a different zone. 3. Choose the next zone. Select York team in the legend, then click its shapes on the map. They turn blue; the existing North team shapes remain green. If you click a shape already owned by another zone, you move it into the zone you have selected.
Adds a name box and colour square. Type the name to create the entry. Keep it short enough to sit comfortably in the key; the name box allows up to 29 characters. An empty draft is not a useful territory.
Click into an existing name box to select that territory and edit its wording. The lettering in the key updates as you type. Renaming does not move its assigned polygons to a different team. You can also select a territory by clicking its name on the map key.
Click the square beside the name, or the matching square in the map key. Choose a new swatch in the palette. All polygons belonging to that entry follow the change. Two territories can use the same colour, but different colours usually make them easier to read.
First click the zone name you want in the legend. Then click once inside a postcode or county shape on the map itself, away from its boundary line. That shape fills with the selected zone’s colour. Repeat for every shape in that territory; you do not have to select the zone again between clicks. To work on another territory, click its name in the legend first. Clicking a shape already assigned to the selected zone clears it; clicking one belonging to a different zone moves it into the selected zone. Check the Colour: control on maps with two boundary levels, so a click affects the district or whole area you intend.
The red cross beside a name deletes that entry and clears the polygons assigned to it. It is more than removing a line of text from the key. To keep the territory but change its wording, edit the name instead. Save a copy before a substantial reorganisation.
Use Undo on the top toolbar to step back through colouring changes; Redo reapplies a change you have just undone. Do not rely on these buttons to reverse every kind of edit, import, deletion or account action. A separately saved copy is the safer way to keep a previous version.
Build your map
Key Settings: layout & visibility
The key explains the territory colours. Keep it large enough to read, but small enough to leave useful space for the map.
Untick to hide the key without deleting its names, colours or territory assignments. Tick it again to bring it back. This is useful when the map will sit beside a separate explanation in a report.
Arranges the entries vertically. It is usually the clearest option for long names, extra text or statistics. This changes the key layout, not the page orientation.
Arranges entries across the key. Use the rows selector that appears to choose between one and six rows. More rows make the key less wide; fewer rows make it shallower. Check longer names and any extra details after changing the layout.
Opens the editor for extra lines beneath each territory name. Use these for a contact name, telephone number, depot address or a short note. The entry names and territory assignments stay as they are.
Restores the key’s default position and size. It is the quickest way to recover a key that has been dragged off the page or made too small to find. Move and resize it again once it is back in view.
Build your map
Click, drag & resize the key
Different parts of the key have different jobs. Aim at the background to move it, at a name to select or reorder it, and at a colour square to change its colour.
3. Choose the next zone. Select York team in the legend, then click its shapes on the map. They turn blue; the existing North team shapes remain green. If you click a shape already owned by another zone, you move it into the zone you have selected.
Click the zone name in the legend to make it your active territory; the name becomes highlighted. Move onto the map and click inside the shapes you want to give that zone’s colour. Selecting the name alone does not colour anything. Keep clicking map shapes to grow the territory, then select another legend name when you want to use its colour.
Opens the colour palette for that entry. Choosing a swatch updates the key square and the polygons assigned to the entry. Use the name beside it when you only want to select the territory.
Hold a blank part of the key background or its frame, drag to the new position and release. All its entries move together. Keep it inside the page in Print View so it is included in the download.
In the vertical key, drag the name to its new position in the list. Its colour square and associated detail move with it, and the list is laid out again when you release. This changes the order of the key, not the boundaries of the territories. Use a clear up/down movement rather than dragging the background.
With the pointer over a portrait key, scroll down to make it smaller and up to make it larger. The whole key scales together. Move the pointer back over the map to zoom the map instead. If the key has become awkward to handle, use Key Settings → Reset position.
Build your map
Extra text beneath key entries
Add useful contact details or notes without squeezing everything into the territory name. Changes in this dialog are held until you choose Apply to legend.
Select a territory in the entry list, or use the previous and next buttons to work through the key. The text box and preview show the selected entry. This is handy when adding a telephone number for every team.
Type or paste the lines to appear below that name. Use short, readable lines; up to 20 nonblank lines and 4,000 characters are accepted per entry. A postcode here is printed as text only. It does not colour or locate that postcode.
Put the existing territory name in the first column, then one detail per following column. Paste the table into the import box. Names must match entries already in the key; check the import feedback for any unmatched names.
Use this option when the spreadsheet should become the new set of notes, rather than retaining previous text. Blank values can clear existing notes when replacement is selected, so check your pasted rows first. Then use Add to these details to load the table into the dialog.
Review the selected name and its notes before applying. Long lines can make a key wide; splitting an address over a few short lines is often easier to read. Statistics selected in Additional Data are separate from these manually entered notes.
Apply to legend commits the dialog’s changes to the current map. Cancel or the close button leaves the map’s existing notes unchanged. Save the map afterwards if you want the new notes to be there when you reopen it.
Build your map
Map Titles: title & key heading
A useful title says what the colours mean. “Sales territories — September” tells a reader more than “Map Title”.
Edit this box to change the title across the top of the page. It updates on the artwork as you type. The field allows up to 55 characters. The title is easiest to judge in Print View, where the title bar is visible.
Changes the heading above the key entries, for example “Regional contacts” or “Delivery zones”. The field allows up to 35 characters. Keep it short if you want a compact key.
The name entered under Save identifies the editable map in your file list. Changing the map title or key heading does not automatically rename that file. Use meaningful wording in both places so the artwork and saved copy are easy to recognise.
Build your map
Map Colours: page, labels & boundaries
These controls change the supporting artwork. Territory colours are changed beside their names in START HERE or in the map key.
Changes the page/map background behind the polygons. A pale background keeps the territories prominent; a white background often suits a printed report. Click the swatch row to open the palette.
Change the lettering for the main map labels and the more detailed postcode labels separately. Mixed-boundary maps can also offer County Names, ICB Names or a similar extra layer. Only controls relevant to your map are shown.
Changes line colours for each available boundary layer. A darker outer area line and a lighter district line can make a busy map easier to understand. Change line thickness or hide a layer in Map details.
Returns the page background, title, border, map label and boundary colours controlled here to their defaults. It is a reset of the supporting map styling, not a command to delete all your territory names and assignments. Save a copy first if you may want to return to your previous styling.
Build your map
Choose a colour
The palette is used by territory squares and by many appearance controls. Check which item you clicked before choosing a new colour.
Applies that swatch to the item whose colour control you opened. For a territory, all its assigned polygons follow the new colour. For a line or title control, only that part of the artwork changes.
Use the arranged shades to choose related colours, or a strong contrasting colour for something that needs to stand out. Pale fills with darker borders usually keep small labels more legible than very dark fills.
Use its close control when you have finished or opened it by mistake. Opening a colour control is not itself a colour change. On smaller screens, move or scroll the palette as needed to reach the swatches.
The advanced import dialogs accept colour names or hex values where their column guide says so. A hex value such as #E8AC25 is useful when the same brand colour must be repeated. The Excel territory import has its own colour-name catalogue; use names from that catalogue for predictable results.
Build your map
Map details: boundaries & place labels
Keep the detail that helps your reader and hide what gets in the way. The available rows depend on the map’s actual layers.
Before hiding. The green and blue shapes belong to our zones. With Hide unassigned areas off, the surrounding postcode shapes and place labels are still visible. Compare this with After hiding: the map position, scale, zone colours and selected detail layers are the same. After hiding. Hide unassigned areas keeps the assigned territory and the useful detail within it, including relevant place labels and parts of wider boundaries. It hides the surrounding artwork rather than deleting it. Use the same control again to restore the full map.
Tick Borders for Areas, Districts, Sectors, Counties or the other layers offered by your map. Untick to hide those lines without removing the polygons or territory assignments. Showing an area border and hiding the district borders can make an overview much cleaner.
Choose a line width for each boundary layer. Use heavier lines for the broad divisions and finer lines for small districts. Review the result at the scale you intend to print; a line that looks fine when zoomed in may dominate a small graphic.
Tick Labels for a layer to show its names/codes. You can show labels without boundary lines or lines without labels. District and sector labels get crowded on a national view; they are more useful on a regional crop.
Focuses the map on the polygons assigned to territories and the relevant surrounding map detail. It hides unwanted artwork rather than deleting it. See the dedicated topic for how labels, broad boundaries and the Google preview are treated.
The Names column controls settlement names separately for each available class. Start with cities and add towns or villages if the local detail helps the reader. These labels are part of the map artwork; they are not marker boxes you created.
The Dots column controls the point symbols independently of their names. You can keep names while hiding dots or use dots without names. These are built-in place dots, separate from the postcode dots created in Create Dots.
Click a section heading such as Borders & labels or Places to fold its controls away. Folding a group only tidies the panel; it does not switch off its map layers. Extra rows such as Outer labels appear only on maps that contain that detail.
Build your map
Show only your assigned territories
Use Hide unassigned areas when you have coloured the part of the country that matters and want everything else out of the way. It is especially useful for a regional sales or service map.
Before hiding. The green and blue shapes belong to our zones. With Hide unassigned areas off, the surrounding postcode shapes and place labels are still visible. Compare this with After hiding: the map position, scale, zone colours and selected detail layers are the same. After hiding. Hide unassigned areas keeps the assigned territory and the useful detail within it, including relevant place labels and parts of wider boundaries. It hides the surrounding artwork rather than deleting it. Use the same control again to restore the full map.
Create your zone names in START HERE. Select a zone by clicking its name in the legend, then click the shapes on the map that you want to keep in that territory. Repeat for any other zones before hiding unassigned areas. The tool checks which shapes belong to a zone, rather than simply which ones look coloured: a shape deliberately assigned a white fill still belongs to its territory.
The tool keeps the assigned polygons and limits other map detail to the useful territory footprint. It considers the broader boundaries and place labels/dots as well as the small polygons, so an area boundary is not discarded just because you coloured districts within it.
The normal Map details switches still matter. If town names were already hidden, this setting does not turn them on. Start with the details you want, then use Hide unassigned areas to restrict their geographic extent.
Use the same button to restore unassigned artwork. Your territory colours remain. If everything disappears, check that you have actually assigned polygons to a territory, and that the relevant regions and layers are enabled.
Save the map after changing the setting. Reopening retains the setting with the rest of the map. Older saved maps that never used it retain their normal full-map behaviour until you choose to enable it.
The polygon overlay shows only assigned polygons when this setting is on. The geographic background remains available, so roads and places on that background can still be seen outside your territories. Return to Design or Print View to change the setting, then reopen On Google.
Build your map
Regions, London & inset maps
An inset is a separate, enlarged view of part of the map. Use it to show dense detail such as London without enlarging the entire country.
Tick the countries or regions you want included. UK maps can offer England, Scotland, Wales, Northern Ireland, the Republic of Ireland, the Isle of Man and the Channel Islands. The list reflects what is present in that map; a switch cannot add a region that the map does not contain.
Shows or hides the separate London view. When it is available, choose Top right or Bottom left for its position. Check that the inset does not clash with your key or other annotations.
Shows the boxes around the inset maps, helping readers distinguish them from the main geography. Untick for a cleaner composition if the separation is already obvious.
Adds the ULEZ boundary layer where supplied by the map. Its width control adjusts the line. This is a reference layer in the artwork, not a live vehicle eligibility or charging check.
NHS maps can offer named health regions and a London inset. Northern Ireland maps can offer separate top-left and top-right views. Other country maps show their own region switches, such as Australia and Tasmania. Each switch shows or hides that supplied group; the rest of the controls work in the same way.
Advanced dots and marker imports have their own choices for putting London locations on the inset or main map. If a location seems missing or appears twice, check both the inset visibility here and the placement option in the import dialog.
Build your map
Roads, land & specialist map layers
Road and mixed-boundary maps contain extra layers. They appear in Map details only when that map includes them. Use the names below to decide what is worth keeping in the finished artwork.
A Roads, Main A Roads / Primary A Roads, Other A Roads and Motorways control the corresponding road line groups. Turning off minor roads while retaining the main routes often makes territory colours easier to see. A road layer here is artwork, not a route calculation.
Road Numbers, Main A Rd. Nums, A Road Numbers, Primary Road Numbers and Motorway Numbers control the text labels for the relevant routes. Junction Numbers shows junction identifiers; Junction Number Circles and Road Num. Borders control their surrounding symbols where present. Labels and road lines can be switched separately.
Land, Parks & Forests and Urban Areas show their respective background fills. If these compete with the colours of your territories, hide one layer at a time and compare the result. Park Names has a separate switch on maps that include it.
Water & Lakes controls water features; Water Names controls their labels. Coastline draws the coast outline, and Railways draws the railway layer. Retain them when they help someone recognise the region; hide them when they add unnecessary clutter.
Other Names, Other Town Names, Primary Town Names and Urban Town Names are separate name groups supplied with road maps. Outer labels on some health maps are names placed outside crowded boundaries. Their visibility does not change which polygons belong to a territory.
A mixed map can show postcode polygons with another administrative boundary over them. Use that layer’s Borders, Width and Labels controls independently. Colouring a postcode district and showing an ICB outline are different operations; the outline supplies context for your territory.
Add locations & coverage
Radial Circles: distance rings
Draw equally spaced circles around a depot, office or other centre. These are straight-line distances. Use Distance/Time when road travel matters.
Distance rings on the map. A set of three rings with a 5-mile interval gives radii of 5, 10 and 15 miles from the same centre. The labels and line colours make the distances easy to distinguish. These are straight-line distances, so they are useful for a radius-based service area; use Distance/Time for a journey-based view.
Shows or hides all the circle sets without deleting them. A hidden set retains its centre, colours and labels. Placing a centre makes the circles visible so you can see what you are positioning.
Selects the set you are editing. Each set has its own centre. Use + to add another set, or the … menu for rename, duplicate and other set options. A separate topic explains linked settings.
Tick it, then click the map where the centre should sit. Another click moves the same selected set; it does not add another set. Turn placement off when the centre is correct, so subsequent clicks can be used for normal map editing.
Enter a postcode and click Find to position the selected set accurately. Supported postcode/ZIP lookup depends on the map. A full postcode is more precise than a broad district. Check the centre on the map before using the results.
Sets how many rings are drawn, from 1 to 20. Four circles at a 10-mile interval produce radii of 10, 20, 30 and 40 miles. Reducing the count hides the extra rings; increasing it again can bring their settings back.
Sets the gap in radius between rings, from 1 to 100 miles. The outer-circle readout is the number of circles multiplied by this interval. These distances do not account for roads, rivers, traffic or travel time.
Adjust the line width and the lettering on the circles. Use modest values when many rings overlap. The controls affect the selected set, or every set if linked settings are enabled.
Each row shows its radius, a colour square and an editable label. Click the square to recolour that ring and type wording such as “Local delivery” or “20 miles”. Labels explain the rings; they do not change the distance calculation.
Add locations & coverage
Several circle centres & linked settings
Use more than one set to compare depots or branches. Separate centres can share a common distance scale while keeping their positions independent.
Distance rings on the map. A set of three rings with a 5-mile interval gives radii of 5, 10 and 15 miles from the same centre. The labels and line colours make the distances easy to distinguish. These are straight-line distances, so they are useful for a radius-based service area; use Distance/Time for a journey-based view.
The Circle set list tells you which centre and rings the panel is editing. Select a set before moving its centre or changing its appearance. Use recognisable names so you do not move the wrong depot.
Creates another circle set and selects it. Give it a centre using the map or postcode lookup. Adding a new set is different from clicking the map again in placement mode, which moves the existing selected set.
Open it to rename the selected set, duplicate it or delete all sets. Renaming is for your own organisation. Duplicating is useful when a second depot needs similar circles: move the new set to its own centre afterwards.
Choose Rename, enter a useful name, then confirm with OK. Cancel leaves the current name unchanged. The set name identifies it in the controls; the individual ring labels are edited separately.
Links the ring settings across sets. The selected set’s settings are used as the common starting point; subsequent linked changes affect all sets. Centres remain independent. Leave linking off if the depots need different ring counts, distances or styling.
The panel’s delete button removes the selected set. Delete all sets in the options menu removes every set. Use Show all circles if you only want to hide them temporarily.
Add locations & coverage
Find postcodes inside circles
Turn distance rings into a postcode list or coloured territory. The selection is based on the representative centre of each postcode polygon, not on whether any tiny part of its outline touches a circle.
Builds a list of postcode areas or districts whose centres fall within the circles. Check the ring centre and distances first. Large rural polygons may cross the circle edge even when their centres fall on the other side.
Shows the result as postcode and zone values. You can select and copy it into a spreadsheet to inspect or use elsewhere. Treat it as an area-based selection, not a list of every individual delivery address.
Uses the generated list to colour map polygons. This changes territory assignments; finding or copying a list alone does not. Check the result around the edge of the rings and save a copy before replacing established territories.
Opens the separate bulk circle importer where available for the account. Use it when you have multiple centres and ring settings ready in a spreadsheet. It is separate from the advanced dots importer.
Add locations & coverage
Advanced concentric-circle import
Open Advanced import in Radial Circles to work in this overlay. Each row describes one centre and its distance rings. Start with the sample CSV, review the columns, then import when they are ready. The map stays in place behind the window.
Distance rings on the map. A set of three rings with a 5-mile interval gives radii of 5, 10 and 15 miles from the same centre. The labels and line colours make the distances easy to distinguish. These are straight-line distances, so they are useful for a radius-based service area; use Distance/Time for a journey-based view.
Choose a file in the supplied sample format. Loading fills the columns for review; it does not place circles yet. The CSV needs its heading row, including ring_id, ring_postcode, num_circles, ring_interval, ring_stroke_thick and ring_label_size, followed by the individual ring labels and colours.
Give each row a unique ID using letters, numbers, underscores or hyphens, plus a full UK postcode for its centre. An ID matching a set on the map updates that set. A new ID adds a set, and other set IDs are kept. Duplicate IDs within the import or a missing postcode stop it before any circles change.
Use a whole-number count from 1 to 20 and an interval from 1 to 100 miles. The outer radius is their product. Each row needs its own values; a single value does not automatically apply to every centre. On a small screen, scroll across the columns to reach the settings on the right.
Enter a whole-number line width from 1 to 5 and a label size from 1 to 10 for each set. These use the same ranges as the Radial Circles panel. Keep each row aligned with its postcode when pasting values from a spreadsheet.
Enter a comma-separated list on each row, from the innermost to the outermost ring. Put a label containing a comma in double quotes, for example "North, depot",Outer ring. Blank labels are allowed. The CSV file uses separate ring_label_1, ring_label_2 and subsequent columns; loading converts them into the lists shown here.
Enter colours in the same inner-to-outer order. The existing importer supports red, blue, green, yellow and black. Supply a colour for each visible ring; a blank colour leaves that ring’s outline hidden. The sample CSV uses separate ring_colour_1, ring_colour_2 and subsequent columns.
Checks the settings and locates every postcode before drawing any sets. Progress and errors appear below the columns. A failed lookup leaves the existing circles unchanged. After a successful import, matching IDs are updated, new IDs are added and the rings are shown. Close the window to inspect them; the normal Radial Circles controls can then edit them.
Empties the draft fields and file selection. Circle sets already on the map remain. Use this when preparing another import; use Delete all circle sets from map only when you want to remove the artwork.
Expand this section for Show / hide on map and Delete all circle sets from map. Hiding retains the sets for later; deletion removes all circle sets, including ones created outside this import. Neither action deletes independent dots or marker boxes.
Closes the overlay and opens the working postcode finder in Radial Circles. It lists postcode polygons whose representative centres fall inside the circles, with results available for copying or colouring. It does not test every address or every part of a polygon, so review edge cases.
Downloads the current columns as circles-data.csv in a format this importer can load again, including IDs, labels and colours. This is the draft in the window, which may differ from the sets currently on the map. Keep the editable map saved as well if you need all its current settings.
Expand Column guide for the field rules or use Watch tutorial. Close, the cross, Escape or a click on the shaded background dismisses the overlay and keeps your draft. Closing during postcode lookup cancels that import and leaves existing sets intact. Once an import has completed, closing does not undo it.
Add locations & coverage
Marker Boxes: labelled places
Use marker boxes for an office, customer, depot or meeting point that needs a visible label and callout. They sit on top of the map rather than replacing territory colours.
Marker boxes on the map. These are placed marker boxes: each label is connected to a location on the map. One uses an arrow with the text above the point; the other uses a line with the text below it. You can change the wording, text size, colours and call-out, and move a selected marker using Place on map.
Shows or hides the marker layer. Existing marker text, styling and positions are retained. Use this to compare a clean territory map with the annotated version.
Adds a marker row and selects it, with the text field ready to type into. Give it a useful label. The count in the panel shows how many markers are present.
Use the selection control beside a marker row to make it the active marker. Edit its text in that row. The row’s delete control removes that marker alone. Selecting a single marker returns you from “all markers” styling to that individual marker.
With a marker selected, tick Place on map and click its location. Click again to move that selected marker. Untick when you are finished. This is the reliable way to reposition a marker; dragging the underlying map moves the map composition.
Tick before changing appearance if every marker should use the same settings. It affects the styling of all markers, not their individual label text or locations. Leave it off to give one important location a different treatment.
Open the palette from the appropriate colour control. Give text enough contrast against its box and the map beneath it. The advanced importer also supplies a per-row box colour.
Changes the selected marker’s lettering, or every marker when Apply style to all markers is on. The slider runs from 0.5 to 20. Check the final page view, not just a close-up of the map.
Open Call-out settings and adjust Length to move the label farther from or closer to its anchor. A longer callout can keep text clear of a crowded area. This changes the annotation, not the geographic location being marked.
Choose a plain line or arrow for the callout. Invert marker puts the box on the other side of the anchor, useful when a label would cover another feature or fall off the page.
Removes the whole marker collection. It does not delete territory colours or built-in place dots. Hide markers instead if you want to bring them back later.
Add locations & coverage
Import marker boxes from postcodes
For a list of branches or customers, import the postcodes and matching labels together rather than placing each marker by hand.
Marker boxes on the map. These are placed marker boxes: each label is connected to a location on the map. One uses an arrow with the text above the point; the other uses a line with the text below it. You can change the wording, text size, colours and call-out, and move a selected marker using Place on map.
Paste one full postcode per line, without a heading row. Keep the order exactly the same as the labels in the neighbouring box. The count helps you spot a missing row.
Paste one matching label per line. For example, the first postcode and first label must describe the same branch. Avoid sorting just one column in your spreadsheet.
Looks up the postcode locations and creates the marker collection from the paired columns. Check the resulting markers and any failure message. Use a saved copy before replacing an existing set of annotations.
Opens the modal importer with extra columns for size, colours, callout, position and London inset handling. Use it when individual rows need different styling or you want a reusable CSV file.
Add locations & coverage
Advanced marker import: every column
Choose a CSV file or paste an Excel table into the Postcodes box. You can also paste the columns individually. Up to 500 rows are supported; CSV files must be smaller than 2 MB.
Marker boxes on the map. These are placed marker boxes: each label is connected to a location on the map. One uses an arrow with the text above the point; the other uses a line with the text below it. You can change the wording, text size, colours and call-out, and move a selected marker using Place on map.
The sample provides the expected column order. CSV files may have a recognised heading row; paste separate columns without headings. Loading a file fills the dialog for review before Import to map. Multi-line spreadsheet cells are joined with spaces.
Use a full UK postcode on each row and its matching label beside it. Postcodes are required; labels can be blank. A whole tab-separated Excel table pasted into Postcodes is spread across the columns.
Sets the size for each marker, from 0.1 to 100. A blank setting uses 5. Enter one value on its own to use it for all postcodes, or supply one value per row for different sizes.
Use a colour name, a supported palette name such as teal400, or a hex value such as #E8AC25. Blank settings use black text and a white box. One colour value can apply to all rows.
Position accepts above or below. Callout accepts line or arrow. Defaults are above and line. These control the marker’s annotation, not the postcode coordinates.
Use auto to detect London postcodes, true to use the inset, or false to use the main map. The legacy numeric forms 1 and 0 are also accepted. Make sure the London inset is visible if you choose to put markers there.
An optional column can contain one shared value or one value for every postcode row. Other column lengths are rejected so rows do not silently shift. Blank optional cells use the defaults. Read the status message if a value or row needs correcting.
Open Manage marker boxes on this map. Show/hide changes visibility and Delete all markers from map removes the collection. Download your marker data exports the current column contents, which can include edits you have not imported yet. Clear columns only empties the draft fields.
Import to map validates and replaces the current markers with the imported collection. Check any unavailable postcode results. Close leaves the current artwork alone if you have not imported; it also stops an in-progress import. Clear columns clears the draft fields, not the markers already on the map.
Add locations & coverage
Create Dots: postcode locations
Plot customers, sites or depots from a list of postcodes. A dot can be a small location symbol or a large circle with a radius in miles.
Different dots and shapes. Advanced dots can use circles, squares, triangles, hexagons and stars. Different shapes and colours help distinguish depots, customers or other location types. The larger hollow circle demonstrates a coverage-style outline; the basic dot controls also let you adjust fill, transparency and line appearance. These are example positions.
Paste full postcodes, one on each line. The entry count helps you check the list. This panel is intended for the supported UK postcode maps; do not assume an overseas postal code can be geocoded simply because another map is open.
Empties the postcode entry box. It does not mean “delete the dots already on the map”. Use the delete button for that, or the visibility checkbox to hide them temporarily.
Sets the size of the circles around the postcode locations, from 0.2 to 20 miles in this panel. It is a radius, not a diameter. Use a small radius for location points and a larger one to suggest straight-line coverage.
Sets the inside colour of the dots. Use More appearance options to make that fill translucent, allowing the territory map beneath it to remain visible.
Looks up the supplied postcodes and draws the dots using the chosen appearance. Check the map and any lookup feedback before considering the import finished. Keep a copy of your postcode list if you will need to repeat the import.
Removes the dot collection from the map. It does not clear built-in settlement dots or marker boxes. Use Show dots if you only want them temporarily out of sight.
Add locations & coverage
Dot transparency, outlines & dashes
Open More appearance options in Create Dots to soften overlapping coverage circles or distinguish different kinds of location.
Different dots and shapes. Advanced dots can use circles, squares, triangles, hexagons and stars. Different shapes and colours help distinguish depots, customers or other location types. The larger hollow circle demonstrates a coverage-style outline; the basic dot controls also let you adjust fill, transparency and line appearance. These are example positions.
Sets how strongly the outline is drawn, from completely transparent to fully opaque. Reducing it is useful when many large circles overlap. A zero-opacity line is still present but invisible.
Sets the transparency of the inside of the circles. Lower it to see boundaries and territory colours underneath. At zero, only the outline remains visible if the line itself has nonzero opacity.
Choose Solid or Dashed. The dash-length control appears for a dashed line and changes the spacing pattern. A reopened map may show Saved pattern for an existing custom dash arrangement; selecting a standard pattern replaces that arrangement.
Changing transparency or dash pattern changes appearance only. Changing the radius changes the size of the coverage circle and can therefore change which postcode centres are found inside it. Regenerate a postcode list after a radius change.
Add locations & coverage
Postcodes covered by dots & shapes
Large dots and imported shapes can be used as selection areas. The postcode tools test polygon centres, so the result is a practical area selection rather than an exact address coverage list.
Open Postcodes & colouring and choose Find postcodes after drawing the dots. The result contains the map’s postcode polygons whose representative centres fall inside the shapes.
Select the result text and copy it into a spreadsheet for checking or further work. A polygon can straddle a shape boundary; whether it is included depends on its centre.
Applies the result as territory colouring. This changes the underlying polygon assignments, while the dots remain a separate layer. Review overlaps and the edges before saving the new design.
Manage dots & shapes in the advanced dialog has Find postcodes inside shapes and Colour areas, with a Postcode, shape postcode result list. Use that version when your coverage shapes were imported with their own row settings.
Add locations & coverage
Advanced dots & shapes: every column
This importer adds labels and per-location styling, including squares, triangles, hexagons and stars. Review the columns before importing: the new collection replaces the existing dots and shapes.
Different dots and shapes. Advanced dots can use circles, squares, triangles, hexagons and stars. Different shapes and colours help distinguish depots, customers or other location types. The larger hollow circle demonstrates a coverage-style outline; the basic dot controls also let you adjust fill, transparency and line appearance. These are example positions.
Load a CSV smaller than 2 MB, with up to 500 rows. Download sample CSV for the expected order. A recognised heading row is allowed in a file; paste separate columns without headings. A whole Excel table can be pasted into the Postcodes box.
Use full UK postcodes, one per row. Labels are optional, so a location can be a plain shape. Keep each postcode and its settings on the same row. Multi-line spreadsheet cells are joined with spaces.
A distance in miles, from 0.1 to 500; blank cells use 10. This controls shape size around the location. It is not the line thickness or a screen-pixel measurement.
Use circle, square, triangle, hexagon or star. Blank settings use circle. Keep the spelling from the column guide so the importer can recognise the shape.
Use top, bottom, left, right or middle, with top as the default. Choose a position that keeps text away from a neighbouring shape or important map label.
One setting on its own applies to every postcode. Otherwise supply one row per postcode. Blank optional cells use the defaults. The status line identifies invalid rows or values before import; fix them rather than shifting a column to make the counts match.
In Manage dots & shapes, choose Inset map, Main map, Inset & main map, or Hide London dots. This is separate from whether the London inset itself is visible under Regions & Insets.
Show/hide changes map visibility; Delete all dots from map removes the collection. Download your dot data exports the values currently in the dialog’s columns, including draft edits: keep a copy before clearing or replacing them. Find postcodes inside shapes and Colour areas work on the map shapes and polygon centres.
Import to map validates and replaces the map’s dots and shapes. Check the final lookup feedback for missing locations. Close leaves unimported drafts unapplied and stops an in-progress import. Clear columns empties the draft input fields, not the current map layer.
Add locations & coverage
Distance/Time: road-travel areas
Travel areas follow the road network, so their shapes differ from straight-line circles. Use them to explore a service area or compare travel bands from a starting postcode.
Travel areas on the map. Isochrones are travel-area shapes. Their irregular edges show why a time-based catchment can look very different from a circle: the available network affects how far you can travel. This is an illustrative display made with the tool’s renderer, not a calculated route or journey-time estimate. Use Create areas with your own starting location and settings to calculate your map.
Choose Distance for miles travelled or Time for minutes. The number field changes its meaning with this choice. A 20-minute area is not the same as a 20-mile area or a 20-mile radial circle.
Enter the outer travel limit you want to explore. Travel areas are calculated estimates from the routing service and road network, not a promise that every journey will take exactly that time.
Choose 1, 2, 3, 4, 5 or 10 equal bands within the total. For example, a 30-minute limit with three bands represents 10, 20 and 30 minutes. More bands show detail but add visual complexity.
Sends the calculation and replaces the previous travel areas with the result. Wait for it to finish before clicking again. The online routing service is required. In the locked/sample tool, the calculation uses sample settings (20 miles and three bands) and displays an unlock message; it does not honour every requested value.
Each band has a colour control. Choose a progression that lets readers distinguish nearer and farther bands. Change the origin, measure or limits and calculate again if you need different geography; recolouring alone does not recalculate it.
When travel results are present, the visibility controls let you hide the shapes or their legend separately. The areas remain available until deleted or replaced. This is useful when comparing them with your territory assignments.
Drag the travel legend background to move it. Scrolling over it changes its size independently of the map, with down making it smaller and up larger. Use Reset position to bring it back if it is off the page or awkwardly sized.
Removes the calculated travel areas. It is different from hiding them. Save a copy if the previous calculation is an important comparison you may want later.
Add locations & coverage
Turn travel areas into territories
The postcode tools connect a calculated road-travel area to the postcode boundary map. This is useful for producing an area list or a first draft of a delivery territory.
Travel areas on the map. Isochrones are travel-area shapes. Their irregular edges show why a time-based catchment can look very different from a circle: the available network affects how far you can travel. This is an illustrative display made with the tool’s renderer, not a calculated route or journey-time estimate. Use Create areas with your own starting location and settings to calculate your map.
After creating travel areas, open Postcode tools and run the postcode search. It tests whether the representative centre of a postcode polygon lies within the travel area. It does not test every address or every point on the polygon boundary.
Copy the result into a spreadsheet to review it or use it in another task. Inspect large polygons along the edge: their centre can be inside the travel area while part of the boundary lies outside it.
Applies the list as territory colouring. This is a separate operation from calculating and displaying travel shapes. Save a version before using it to replace hand-built territory assignments.
If you change the origin or travel limits, create the new areas and find the postcodes again. A previously copied result is a snapshot of the earlier calculation.
Bring in your data
Import Excel: postcode territories
Use this panel when a spreadsheet already tells you which postcode belongs to which territory. The data is matched to polygons in the selected map.
Copy the postcode column from Excel and paste it here, one postcode per row and without a heading. Use codes that exist at the selected map’s level. Keep codes such as leading-zero ZIP codes as text in your spreadsheet.
Paste the matching territory names in the same row order. Repeated names put several postcodes into the same territory. Leaving the entire column blank uses Zone 1. For a meaningful multi-territory map, supply a name for every postcode.
The Clear button below a column empties that input. It does not act as a general “clear my map” command. Clear and replace both columns together when importing a different table.
Reverses both columns together and updates the map from the reversed data. It is useful for changing the order in which names appear in the key. It is an action on the import, not just a cosmetic sort of one text box.
Choose the family of colours to use when the importer assigns colours to territories, or choose Random. Related shades can suggest a series, but clearly different colours are usually better for unrelated sales teams.
Processes the paired columns and colours the matching polygons. Check any feedback and inspect the result: a district code cannot create missing sector geometry. Save a separate version before importing over a map you may need again.
Opens the larger dialog with a third column for your chosen colours and an optional table for extra key text. Use it for a repeatable colour scheme across several maps.
Open the sample chooser to see prepared examples. Selecting a sample imports it immediately, so save your current work before experimenting. Samples are useful for learning the required data structure.
Bring in your data
Excel import with your own colours
Paste matching postcode, territory and colour columns. Use the same colour consistently for every row belonging to the same territory.
Paste one code per row, without headings. Copy all related columns from the same table so a sort or filtered selection does not put the wrong name beside a postcode.
Supply the territory name for each row. Repeating a name groups those polygons together. Check spelling, spacing and punctuation if you expected one territory but see several similar names in the key.
Paste the matching supported colour names, or leave the colour column blank to use automatic colours. Use the colour-name catalogue in this dialog for predictable matches. If a colour column is supplied, keep its row count aligned with the other columns.
Use the quick colour choices or open Browse all colours. Search by name, then copy the chosen name into your spreadsheet or the Colours column. If automatic copying is unavailable, select the displayed text and copy it normally.
The optional extra-text table uses the territory name in its first column and further columns for lines of notes. This is separate from the postcode assignment table. Leaving this section blank keeps existing details. You can also edit these notes later in Key Settings → Legend details.
The sample list applies a sample to the map when selected. The copying-help section illustrates how to copy columns from Excel. Use it if pasted data has ended up on one line or in the wrong column.
Applies the import to the current map. Check the result and save it. The dialog’s Clear all command clears its draft fields; Cancel closes the dialog without running the import. Imported territory data can replace existing work, so keep a saved copy first.
Bring in your data
Get a spreadsheet ready for import
Most import problems start with a shifted row, the wrong postcode level or a value formatted unexpectedly by a spreadsheet. A quick check before import saves a lot of tidying afterwards.
Import Excel colours postcode polygons into territories. Create Dots plots locations. Marker Boxes adds labelled locations. Radial Circles draws distance rings. A postcode in a legend note is just printed text. Choose by the result you want, not simply by the fact that your source is Excel.
The postcode, name and settings on row 12 must all describe the same location or polygon. Sort the whole spreadsheet table together. Do not sort the postcode column separately. Check blank rows, merged cells and accidental heading rows.
A UK postcode area such as YO, a district such as YO18, a sector such as YO18 7 and a full postcode such as YO18 7TG describe different levels. Territory import needs codes compatible with the selected boundary map; location tools need full postcodes for precise positioning.
“North team” and a differently spelt version can become separate key entries. Use a single spelling for each territory. Give each territory one consistent colour throughout the sheet.
Postal codes are identifiers, not quantities. Keep leading zeroes where relevant and avoid spreadsheet date conversion. In the advanced location importers, use plain numeric settings and the exact words listed in Column guide.
A loaded file is not always an applied import. Review the fields, choose Import to map, then check any errors or missing postcode results. Keep the original spreadsheet so you can correct and repeat the import without rebuilding it from the map.
Bring in your data
Additional Data: figures in your key
Where datasets are available, the tool can add territory figures to the key. Use them to compare coloured territories, rather than judging coverage by visual area alone.
Use a portrait key, then load the datasets offered for the current map. Activation is unavailable with a landscape key. The list depends on the map, your account and data availability. If none are offered, that does not mean the territory has a zero population or zero records; there is no suitable dataset available in this panel.
Tick a dataset to display its figures alongside the territory entries in a portrait key. Untick to remove those figures from the key. Choose only figures useful to your reader, as several datasets can make the key large.
The figures are assembled from the data attached to the polygons assigned to each territory. They follow the territory grouping, not the visible size of a coloured shape on screen. Check the dataset’s name, date and coverage before drawing conclusions from it.
Review the figures after adding, removing or reassigning polygons. Give the tool time to load the selected data. Extra contact notes entered through Legend details are independent of these calculated figures.
The panel identifies this as a pilot feature. Available datasets and access may change. If the data you need is absent, use the site’s contact link to discuss it rather than treating a missing option as an import setting.
Find your way around
More Maps: find the right boundaries
Choose a map by the boundaries you need to colour. A more detailed map has more polygons and more labels; it is not simply a larger picture of the same map.
Type a place, map type or boundary name into the search box and use the search button. It searches the map catalogue, not your saved files and not the contents of a territory spreadsheet.
Use the textual category headings to browse UK postcodes, ZIP codes, worldwide maps, European maps, counties, NHS, mixed and other boundaries. Open a category to see its map links. The catalogue can change as maps are added.
Opens the selected map. Save your current work before leaving; the new map is a different starting point. Access can be specific to a map type, so owning one map does not automatically mean every catalogue item is unlocked.
These open in the newer VectorMaps tool. It has its own interface and capabilities. The instructions in this handbook describe the classic GBMaps editor, so use the help supplied in the newer tool once you switch.
Areas are broad postcode regions; districts divide them into smaller pieces; sectors provide finer detail again. Choose the level that matches the data you have and the decisions the map needs to support. Use a district or sector map when broad areas cannot represent the boundaries you need.
Find your way around
Help, FAQs & the newer mapping tool
The links beneath the main menus give you another way to get help or explore the newer mapping tool. Scroll the sidebar down to see them.
Opens the newer mapping tool in a separate tab, with the current map region/type passed along where supported. It is useful when you need its wider map catalogue or more complex mapping features. This link does not transfer the customised SVG map or its unsaved changes.
Choose Videos at the top of the handbook for the tutorial directory, or follow the Watch tutorial link in a relevant topic. Videos open separately, so your current map stays in place. Some show an older arrangement of the controls.
Opens this illustrated handbook over the tool, with search, numbered panel pictures and tutorial links. The About GBMaps & the service section covers licences, renewals, accounts, refunds and the business. Close help or choose Back to my map to return to the same work.
Starts a guided introduction over the editor. Follow its steps or close it when you are ready to continue. A tour is useful for getting your bearings; the panel guides here go into the individual settings in more depth.
Use the Contact GBMaps link at the bottom of this guide. Say which map type you are using, the action you took and the exact message you received. A screenshot of the problem is useful. Keep an unsaved map open while you check what went wrong.
Use this button at the top of the handbook to move the topic you are reading into its own browser window. The overlay closes after the new window opens, leaving your work in place. If your browser blocks the window, the guide stays open and asks you to allow pop-ups. You can place the guide beside the map while you work.
The Help & FAQs link in the File Manager heading opens the same handbook, starting with saved maps and files. Back to saved maps or the close cross returns to the manager without submitting an order, renewing a licence or changing any files.
Close this guide to return to your existing work. To change map types, use More Maps in the editor, or the map access choices in your saved-map manager. Save work you want to keep before switching. Help opened from the tool does not contain links that start another map.
Find your way around
Start afresh or switch maps
New starts another map; it does not preserve an extra version of the one on screen. Save a copy first if you want two versions of the same design.
When this choice is available on an unlocked map, it saves the current work before starting afresh. Wait for the save to finish. If saving fails, keep the current page open and deal with the error before leaving.
Starts afresh and leaves unsaved changes behind. The current map type is the starting choice. To choose a different boundary product, use More Maps or Create New Map beside the relevant product in your saved-map manager.
Open takes you to your saved-map manager. Its warning can offer Save & Open and Open Without Saving. Choose the first if you need your recent work, then find the required record and use EDIT. Starting a new map and opening a saved one are different jobs.
Use Save a Copy of this map in the Save menu where it is offered, and give the copy a distinct name. This is the useful route for next month’s territories, an alternative layout or a proposal that must not replace the original.
Save, download & share
Save, open & keep a separate copy
Saving keeps the editable map in your account. Downloading creates a file for use elsewhere. It is worth doing both when the map is ready to share.
The Save menu opens in Print View. Enter a recognisable file name, up to 35 characters. Include a place, purpose or version, for example “North delivery zones Sep”. This name identifies the saved map; it is separate from the title printed on the artwork.
Stores the current editable map and its settings. Wait for the saved confirmation before leaving. When working on an existing saved map, a normal save updates that map. Your downloaded PDF or image is not the editable record used by the tool.
This option appears when editing a stored map. Tick it and give the copy a distinct name before saving if you want to preserve the original. It is useful before a new import, a territory reorganisation or a design experiment.
The buttons beneath Save start PDF, PNG, JPG, SVG, CSV and PowerPoint exports, subject to access. The tool saves/prepares the map as part of the export process. Choose the file type for the job; see Download formats for the differences.
The Open button takes you to the saved-map manager, where you can find previous editable maps and generated files. If it is unavailable, check that you are logged into the account that owns the maps.
Starts a new map. If asked what to do with unsaved work, choose Save first if you need it, or cancel to carry on editing. Starting afresh is not a way to create a safe duplicate of the current map.
Opens the geographic preview from the Save area. The On Google tab is also available in the main toolbar. For current editing, return to Print View or Design; geographic background tiles are not part of the SVG artwork export.
Save, download & share
Choose a download format
Check Print View before exporting: page edges, title, key, hidden layers and annotations all matter. Keep an editable copy by saving it in your account as well.
A good choice for printing or sending a finished map as a fixed page layout. Open the created PDF and check its page size, labels and key before printing. It is not the same as reopening the map for territory editing.
Useful in reports, documents and web pages when sharp lettering and flat colours matter. It is a raster image: enlarging it beyond its exported resolution can soften edges. Check the small labels at the size you intend to use it, and avoid enlarging the image beyond its original resolution.
Useful when you need a widely supported photographic-style image file. JPEG compression can soften small lettering and boundary lines, so PNG or PDF may be a better choice for a detail-heavy map.
Exports the vector artwork. It can remain sharp when scaled in compatible software and is useful for design workflows. The SVG is not a substitute for the tool’s saved account record and settings. Fonts and rendering can vary in other applications.
Exports map assignment data for a spreadsheet rather than a picture of the map. Use it to review or reuse postcode-to-territory information. It does not preserve the complete page design in the way an editable saved map does.
Creates a genuine presentation file containing the map on a slide. It is useful for dropping a finished territory map into a meeting deck. See the PowerPoint topic for what is editable and how the artwork is included.
When the file is ready, the result message shows its details. Download Now retrieves it to your computer; your browser controls where it is saved. Done closes the result message. Check the downloaded file before sending it on.
Follow the access/unlock message for the selected map. If an export fails, keep the editor open, save the map if possible and note the exact error. Do not keep repeatedly clicking a busy export button. The troubleshooting topic covers the common checks.
Save, download & share
Use your map in PowerPoint
The PowerPoint button produces a .pptx presentation, rather than simply downloading an SVG for you to insert yourself.
Set the page orientation and arrange the title, key and artwork. Check Print View, including anything close to an edge. The export captures the print-page artwork even if you were working in Design. It does not export the Google background.
Use the PowerPoint button in Save and wait for the file-created message. Choose Download Now, then open the .pptx in PowerPoint. It contains the finished map artwork on a slide.
The map is included as SVG vector artwork with a PNG fallback for applications that cannot display the SVG. It is a map graphic on the slide, not a slide made from thousands of native PowerPoint polygon objects. Recolour territories in GBMaps for the most reliable update.
Open the exported presentation and copy the map graphic or reuse the slide in your own deck. Keep the graphic in proportion when resizing. If the deck uses a different slide shape, check its placement and margins afterwards.
Reopen the saved map in GBMaps, make the changes, save and export again. Replace the previous graphic in your deck so it does not show outdated territory assignments.
Save, download & share
On Google: explore the geographic preview
See your territory polygons against a geographic background. This view helps you inspect locations and coverage; the print artwork is still edited in Print View or Design.
The tool prepares the current map and loads the viewer. While it is loading, search and other dependent controls may be unavailable. If a load fails, use the displayed Retry action. A preview may show sample colouring when the map is not unlocked.
The sidebar is hidden because those controls edit the SVG artwork and would not immediately change the loaded geographic preview. It cannot be opened in this view. Return to Design or Print View; the sidebar’s earlier visible/hidden state is restored.
Hold and drag the geographic map to move around it. This changes the view of the background and overlay together. It does not drag the territory boundaries into a different geographic location.
Use the mouse wheel, a two-finger pinch or the viewer’s zoom buttons to change scale. Double-clicking the map zooms in. These are geographic-view gestures; they do not change the scale of the map artwork on the printed page.
Enter a postcode or place in the top search and run it. The viewer locates and pans/zooms to the result once ready. Clear removes the search marker/indication without erasing territory polygons. In the standalone viewer its own postcode box is available; the embedded tab uses the shared top search.
Move the pointer over a polygon to see a small popup with its postcode and assigned territory name. The popup follows the pointer and disappears when you leave the polygon. This is an inspection aid; return to the editor to change the assignment.
Return to Print View or Design, edit the map, then select On Google again to prepare a fresh preview. The tab remembers its recent centre, zoom and opacity while you switch views. Do not expect an already loaded external viewer to update every keystroke in the editor.
Save, download & share
Google preview: opacity, key & extent
The preview has its own display controls. They help you read the geographic background without changing the colours or page composition of the SVG map.
Move the slider towards 0 to make the polygon fills more transparent, or towards 1 for stronger fills. A lower value lets background roads and labels show through. It changes the preview overlay’s fill opacity, not the saved print-map colours.
The target-style reset control returns to the viewer’s overview extent. It is separate from Fit map in the artwork editor. Use it when you have panned away from the area you meant to inspect.
Shows territory colours, names and enabled extra legend text. Hold and drag this key to move it clear of an important part of the geographic map. Its entries are for reference: they do not select a territory for painting or reorder the SVG key. Unlike the portrait SVG key, this viewer key has no dedicated wheel-resize control.
Hide unassigned areas carries through to this polygon overlay. The base map remains visible outside the coloured territories. If you see roads or place names there, those can be part of the background rather than unassigned postcode polygons.
Open the Google/view link for the saved map. New views are private to your account until you choose Share this view and confirm that anyone with the link may see the map and its labels. Copy public link gives you the viewing address; it does not let another person edit your map or open your account. Stop sharing switches off the public link and any embeds using it. Existing published links continue to work until their owner stops sharing them.
Drag the key with the mouse or a single finger to place it away from the geography you are inspecting. The movement belongs to this viewer. To place the key for a PDF, return to the editor and move the SVG key there.
Save, download & share
Log in or unlock from the sidebar
The unlock panel lets returning users identify their account and new users see the current offer. Logging in and buying access are separate actions.
The upper Log in button opens the email field. Use it if you already have an account or map access associated with an email address. Opening the field does not make a purchase.
Enter the email used for your purchase, then click Log in or press Enter. The password sign-in box opens over your map. Enter your password there, or choose Set or reset my password if this is your first password or you have forgotten it. The Signing in & passwords section shows every step and the messages you may see.
Shows the current price, VAT wording, duration and included features for this map. A sample can be explored before buying, but its output and advanced actions can be restricted. Check the offer on your actual page rather than the example figure.
Opens the payment-method dialog for the selected map. Review its title, price and terms, then choose a payment method if you want to continue. Returning users should log in first so existing access can be recognised.
Signing in & passwords
Sign in to your maps
Already have a GBMaps account? Use the email address attached to your purchase and your password. Signing in does not buy another licence or change your map. If you used to enter just an email address and have never chosen a password, start with Your first password.
Use the address used for your map purchase. A personal address and a work address are different accounts, even when they belong to the same person. Check the spelling and the ending, such as .co.uk or .com. The example address in these pictures is not an account to use.
Enter the password you chose for GBMaps. It is case-sensitive: capital letters and lower-case letters are different. You can paste it or let your password manager fill it in. The same password covers the map types attached to this email address. It is not your email mailbox password.
Show reveals what you have typed so you can check it; Hide conceals it again. Use this only when nobody nearby can read your screen. This button does not change or submit your password.
Checks your details and continues with your map or the saved-map page you were opening. Wait for the check to finish rather than clicking repeatedly. If the password box is empty, Continue starts email verification instead; it does not sign you in using the email address alone.
Use this if you have forgotten your password or have never set one. It opens the code-request screen. You do not need the old password, but you must be able to receive email at the account address.
The cross closes the box without signing you in. When the box is over the editor, your map remains there, including unsaved changes. Closing the box is not a save. On a separate sign-in page, use its sign-in button to open the box again.
Sign-in proves which account is yours; a licence gives that account access to a particular map type. You can sign in and see saved maps even if a licence has expired. Use the renewal option for that map type. Do not buy again simply because you have forgotten a password.
What this looks like
Real GBMaps dialogs with example account details. Choose View larger to read a message clearly.
Your existing access has been recognised for the selected map type. Signing in has not made another purchase.
Signing in & passwords
Your first password: keep your existing maps
If you have used GBMaps for years by entering only your email address, you still have the same account. You do not need to register again or pay again to set a password. We first check that you can receive email at that address, so somebody else cannot claim your maps just by knowing it.
Choose Log in in the sidebar, enter your existing account email in the small email box, then press its Log in button. In the sign-in dialog, choose Set or reset my password and check the address. You can also begin from the first sign-in box by leaving the password blank and choosing Continue to my maps.
Click once to request a six-digit code. Keep this tab open and check that inbox, preferably in your email app or another tab. You do not need to enter a mobile number or wait for an SMS. If an error says no code was sent, stay here and follow that message.
Return to the Check your email box, enter the code and choose Check my code. It lasts 60 minutes and belongs to the browser where you requested it. The Email verification codes topic explains resending, incorrect codes and expired codes.
After the code is accepted, the heading changes to Make this account yours. Choose a password of 8–50 characters; several words can make it easier to remember. Click Save my password. Your saved maps, colours and licences are kept as they are.
The message Your password is saved confirms that setup succeeded. Enter the password you have just chosen and click Continue to my maps. Setting a password and signing in are two separate steps; this final sign-in is expected.
Returns to the ordinary sign-in box. You can close the box and come back later, but a code or an already verified setup can expire while you are away. If it has expired, request another code. Nothing is changed until Save my password succeeds.
One email and password cover the licences already attached to that address; there is no separate password for each map type. If GBMaps has linked your own email to another account’s licences, use your own email and verify your own inbox. Do not send another person your password or verification code.
What this looks like
Real GBMaps dialogs with example account details. Choose View larger to read a message clearly.
This message confirms that your password was saved. Enter it to continue.
Signing in & passwords
Forgotten your password?
You can choose a replacement password without knowing the old one. The code goes to the email address already associated with your maps. Resetting the password does not delete your designs, use a map credit or renew a licence.
In the sign-in box, choose Set or reset my password. Check the email address carefully, especially if your browser filled it in. Use the purchase address, not a different inbox you now prefer.
Requests the code and takes you to Check your email. Your old password is not needed on this screen. Requesting a code alone does not replace it; the change happens when a verified new password is successfully saved.
Read the email, enter the six digits in this browser and choose Check my code. Choose your new password, click Save my password, then use that new password to sign in. If a password manager offers to update its saved entry, make sure it is updating the GBMaps entry for the right email.
Saving a replacement password signs out older sessions on other browsers and devices. They will need the new password. If a map is open elsewhere, keep the page open, sign in when asked and repeat the save rather than discarding that work.
Contact GBMaps with your order or invoice details. We need to establish that the account is yours before changing its address. Do not create another account or buy again to try to recover the old maps. Support will not need you to send your password or a verification code.
Do not share or enter it for anyone else. Requesting a code does not itself change your password, so an unexpected message can be ignored. If you are concerned, return to GBMaps yourself and reset your password from there.
What this looks like
Real GBMaps dialogs with example account details. Choose View larger to read a message clearly.
Use the replacement password for the next sign-in, including on other devices.
Signing in & passwords
Email verification codes: enter, resend or start again
The Check your email box appears when you set a first password or reset an existing one. The six-digit code proves that you can use that inbox. It is temporary and is different from the password you will choose afterwards.
Type or paste the six digits, without spaces or extra text. Keep this tab open while checking your email. A code requested here cannot be used in a different browser, a private window or another device. If you requested a replacement in this browser, use its newest code.
Checks the digits and opens Make this account yours when they are accepted. A code lasts 60 minutes and works once. After five incorrect guesses you must request a fresh code; do not keep guessing.
Use this if the code has expired or the email did not arrive. Allow at least a minute between requests; repeated requests can mean a longer wait. Requesting a new code in this browser replaces its previous one. If emails arrive out of order, use the most recently requested code.
Returns to the email and password boxes. Use this to correct the email address: choose Set or reset my password again, enter the correct address and request another code. Going back does not change your password.
Check junk, spam and any company email filter, then check the address you entered. Give delivery a little time before requesting another code. The wording If this email address has a GBMaps account is deliberate: this screen does not confirm whether an address is registered. If nothing arrives, contact GBMaps with your purchase details.
Compare all six digits with the newest email requested in this browser. Check that you have not copied an older message. An incorrect attempt does not change your password. The red message appears in the same box so you can correct the digits.
Choose Send a new code and use the replacement. This message can also appear after too many incorrect guesses, after the code was already accepted, or if you are no longer in the browser session that requested it.
What this looks like
Real GBMaps dialogs with example account details. Choose View larger to read a message clearly.
Request a fresh code. There is no password change to undo.
Signing in & passwords
Choose and save your password
Make this account yours means your email code has been accepted. You can now choose a password for this GBMaps email address. Complete this step within 10 minutes of verifying the code; if you leave it too long, verify your email again.
Use 8–50 characters. Spaces are welcome and special symbols are not compulsory. Several unrelated words can be easier to remember than a short jumble. Choose your own phrase: do not use the example in a screenshot, a familiar keyboard sequence or a password used on another website.
There is one password field, so use Show to check it before saving. Hide conceals it again. Pasting from a password manager is allowed. Keep the screen private while the password is visible.
Saves the password for this account and its map types. Wait for the confirmation before assuming it has worked. If red wording appears, read it and correct the problem; the tool has not accepted the new password.
Leaves this step and returns to the ordinary sign-in box. It does not save the password you typed. If you already had a working password and have not saved a replacement, that previous password is unchanged.
You are returned to the sign-in box with this confirmation. Enter the new password and choose Continue to my maps. This final sign-in is required after both first-time setup and a reset; being asked again is not an error.
GBMaps support does not need your password or email verification code. Anyone you give these to may be able to use your account. On a shared computer, decline the browser’s offer to remember the password and use Log out when you finish.
What this looks like
Real GBMaps dialogs with example account details. Choose View larger to read a message clearly.
Most sign-in problems can be resolved in the same box without leaving your map. The pictures below show the actual warnings. Follow the advice for the message you see; repeatedly clicking Continue or requesting codes is unlikely to help.
Check the account email and password, including capital letters. Use Show to look for a typing mistake if your screen is private. If you have never set a password, or cannot remember it, choose Set or reset my password. The message deliberately does not say whether it was the email or password that failed.
The tool could not connect to its email service. Your password has not changed and there is no new code to wait for from that attempt. Leave the map open and try again shortly. If this continues, contact GBMaps and quote the message rather than repeatedly submitting the form.
Requests or guesses are temporarily limited. Stop and wait before trying again. A resend needs at least a minute; lots of requests or sign-in attempts can take longer to clear. The button becoming available does not guarantee that the waiting period has ended. This message does not mean your maps have been deleted.
The code screen uses conditional wording and cannot promise delivery to every typed address. Check the account address, junk folder and any company filter. Use the Email verification codes topic for the resend steps. If you cannot get into the account inbox, contact GBMaps with order details.
Keep the map open and try again shortly. This is a service problem, not a request to buy another licence. If the box says to reopen sign-in, close that box and open it again. If the problem persists, tell GBMaps the exact wording and which step you reached.
Use the GBMaps page beginning with https://. Do not enter your password into a warning page or an unfamiliar website. Keep an unsaved map open while you check the correct address in another tab.
What this looks like
Real GBMaps dialogs with example account details. Choose View larger to read a message clearly.
Repeated clicks can extend the problem. Wait, then make one attempt.
Signing in & passwords
Warnings while choosing a password
These messages appear after email verification, while you are choosing the password. A warning means the password has not been saved. Keep the box open and follow its wording; you do not need to recreate your map or buy access again.
The password is outside the allowed length. Add more words if it is too short, or shorten it if it is too long, then try Save my password again. Spaces count. There is no need to add punctuation simply to satisfy a symbol rule.
Choose a different phrase. A repeated common password, a run of numbers or an obvious keyboard pattern can still be rejected even when it is long enough. Do not make a tiny variation of the rejected example.
Another password change completed after this verification began. Go Back to sign in and use the latest password. If you do not know it, request a fresh code and complete a new reset. The older verification cannot overwrite the newer password.
The verified setup step has expired or is no longer available in this browser session. Go Back to sign in, choose Set or reset my password and request another code. After it is accepted, choose and save the password promptly.
What this looks like
Real GBMaps dialogs with example account details. Choose View larger to read a message clearly.
A sign-in can end after a period of inactivity, when you log out in another tab, or when the password is reset. The editor opens sign-in over your existing map. Keep that page open: closing or refreshing the whole page can discard work you have not saved.
Enter the account email and its current password, then choose Continue to my maps. The map stays behind the box. If the password was changed on another device, use the replacement. Closing the sign-in box leaves the map visible but does not restore account access.
When You are signed in again appears, dismiss the message and repeat the save or download you were making. The interrupted action is not automatically repeated. Check that the save reaches My saved maps, or that the expected file downloads, before leaving.
The tool has refreshed its sign-in information. Read and dismiss the message, then repeat your save or download. Keep the current map open. If it asks for the password again, sign in and try the action once more.
A sign-in lasts up to 12 hours and has a two-hour inactivity limit. A password reset also ends older sessions on other devices. These limits apply to signing in, not to how long a saved map is kept.
An active sign-in is carried into the saved-map manager; you should not have to enter the password for each visit. A direct bookmark can ask you to sign in first, then return you to the permitted page. If the account cannot access a map, check that it belongs to the email you used.
Open the account menu and choose Log out. Save & Logout saves first; Logout Without Saving leaves unsaved changes behind; Cancel keeps you in the editor. Do not assume that merely closing a tab signs you out.
What this looks like
Real GBMaps dialogs with example account details. Choose View larger to read a message clearly.
Use the account control above Save, Open and New. It shows the current account state and the available login/account actions. On a shared computer, check the displayed email before saving work.
One email address and password cover all the map types on your account. Use the email associated with your purchase. A successful sign-in carries through to the saved-map manager, so you do not need to sign in again when you save or open a map.
The tool sends a six-digit code to your account email address. Enter it in the sign-in box within 60 minutes, then choose a password of 8–50 characters. A phrase of several words is easy to remember; spaces are allowed. Your password is saved securely, and you can then sign in. Account verification uses email, not a mobile phone number.
The logout confirmation offers Save & Logout, Logout Without Saving and Cancel. Save & Logout keeps the current work before ending the session. Without Saving leaves unsaved changes behind. Cancel returns you to the map.
Read the leave-page warning. Leave without saving discards unsaved work; Keep editing or Cancel stays on the map. A browser’s own leave-page prompt can look different from the tool’s styled dialogs.
In the expanded account menu, choose Check for invoices to retrieve the available invoice links. Open the relevant link to get the paperwork. This does not open your saved maps or download a map image.
Choose Set or reset my password in the sign-in box. Check that you entered the email used for your purchase, including its ending, and look in your junk folder. Send a new code is available after a short wait. Too many incorrect attempts expire the code. After setting a new password, older signed-in sessions are closed, so your other devices will need the new password.
Contact GBMaps Support with your order or invoice details. We need to establish that the account is yours before changing its email address; knowing an email address or a mobile number is not enough. Please do not send your password to support.
A sign-in lasts for up to 12 hours, with a two-hour inactivity limit. If a session ends while you are editing, the sign-in box opens over the map so your work stays on screen. Sign in, then repeat the save or download. On a shared computer, use Log out when you finish.
Manage saved work
Saved maps: access, renewals & new maps
Sign in to use the saved-map manager. It remembers the sign-in from the editor and shows the maps belonging to that account. A saved design can still be listed when access to its map type needs renewing: an expired licence does not prevent you from signing in to renew it.
Check the map type and its access/expiry information. Access applies to the listed product or map type. A district map and a sector map can have different access states. Do not infer that every map is unlocked from one active entry.
Opens payment for the specific map type whose access has expired or is due for renewal. Check the product title and amount in the payment dialog before choosing a payment method. The saved-map version keeps the relevant renewal context.
Opens the purchase options for the selected map type. It is used for a sample or locked product rather than changing a territory’s colour. Prices and available terms are shown by the current offer.
Starts a new editable map of the chosen type. Use it when you need a clean starting point. To branch an existing design, reopen that design and use Save a Copy instead.
Where an invoice link is available, use it to retrieve the paperwork for that purchase. It is separate from downloading the map artwork. If a purchase or invoice is missing, check the account email and contact GBMaps with the relevant details.
Manage saved work
Find, reopen & manage saved files
Open in the editor takes you to this page. Editable maps, spreadsheet exports and finished PDF files have different actions because they are different kinds of record.
Click a column heading such as file ID, map type, orientation, date or map name to reorder the list. Clicking the active sort heading changes direction. Use a meaningful saved-map name to make older versions easier to recognise.
Use the map’s Edit/open action to return to the tool with its saved territories and settings. A PDF or CSV row is a generated file, so opening it does not provide the same editable map controls.
Opens the additional actions for that row. Depending on the record and account state, these can include CSV creation, ExportVM, transfer, conversion, printing or deletion. Read the row name before choosing an action.
Generates assignment data from the saved map for spreadsheet use. A converted map may need to be opened and saved before this action becomes available. CSV files are listed separately from editable maps.
Downloads the saved Map4 data as a JSON package for a transfer/import workflow. It is a data export, not a PDF and not an automatic opening of the map in VectorMaps. Keep the file intact for the receiving importer.
Use the relevant file row to retrieve a saved CSV or PDF. A generated file is a snapshot from the time it was created. If you change the editable map, export a new file to include those changes.
Check the record before clicking Delete. Editable maps have a confirmation and a restriction on deleting recently created maps. The current PDF and CSV delete buttons can act immediately, without that confirmation. Deleting a generated file is different from deleting the editable map that produced it. Keep any copy you still need.
These appear when access is needed for that map type. Follow the selected row’s action so the payment refers to the correct product. They are access controls, not file-download buttons.
Manage saved work
Saved-map row: the options menu
The three-dot button opens actions for one editable saved map. The available choices depend on the map type, access and whether a conversion has been opened and saved.
Downloads a JSON data package containing the saved Map4 record. Keep the complete file for a compatible import workflow. This action does not convert the map artwork to PDF or automatically open it in the Pro tool.
Asks to export the saved map’s assignments as a spreadsheet file. Confirm the map ID in the message. The generated CSV appears in the file manager’s spreadsheet section.
Checks whether the editable map is old enough to delete and then asks you to confirm the map ID. This is different from the PDF and CSV delete buttons, which can act without a confirmation.
Opens the supported finer-detail conversion for this map. A converted copy is created; the original remains. Review and save the converted map before exporting its data.
Manage saved work
Convert an area map to finer detail
The saved-map manager offers supported conversions so you can start from an existing broad territory design rather than colour every smaller polygon from scratch.
For the supported UK postcode maps, an area map offers Convert to District, and a district map offers Convert to Sector. This is a move to finer detail. It is not a general conversion between any two maps in the catalogue.
Check the source and target, then choose Convert Now or Cancel. Conversion creates a separate upgraded copy in your account with “Conv. ” added to its name; the original is retained. If you do not have access to the new map type, the resulting map may require a purchase before you can use its unlocked features.
Review the inherited colouring, labels and page layout. Smaller polygons give you more precise editing, but also more detail to arrange. Open and save the converted result before relying on downstream file actions such as CSV creation.
Select the detailed Colour: mode, click the zone name you want in the legend, then click the smaller shapes on the map to assign them to that zone. If you later colour a whole parent area, the whole-area warning protects the mixed assignments you have made.
Manage saved work
Transfer a saved map to another account
Transfer moves the selected saved map to a recipient account. Use it when handing over ownership of the editable work, rather than simply sending a PDF for someone to read.
Open Transfer from the correct saved-map row and enter the intended recipient’s account email. Check the spelling carefully. The account and access checks happen as part of the transfer flow.
Starts the transfer of the selected map. Read any follow-up confirmation before proceeding. This is an ownership action, so keep a separate saved copy first if you need to retain your own version.
Having a map transferred does not necessarily give the recipient an active licence for its map type. Follow any access or renewal message rather than assuming the transfer includes a new purchase.
If the recipient only needs to view or print the finished map, send a PDF or image instead. That avoids moving the editable map out of your account.
Manage saved work
Buy, unlock or renew a map
The editor and saved-map manager use the same payment-dialog design. The selected map and reason for purchase still matter: a new unlock and a renewal are different actions.
Read the map name and whether the dialog says Unlock or Renew. In the saved-map manager it follows the row you selected, which may differ from the map you were editing previously.
The dialog shows the selected offer and its details. Use those figures rather than an example screenshot in this guide; prices, VAT and access periods can change. Read the included information before continuing.
Select one of the offered card or PayPal options. This proceeds to the corresponding payment flow; it is not just a colour or style choice. Complete the provider’s steps and wait for the return/confirmation before assuming the map is unlocked.
Open the questions/FAQ section for the current purchase information. It expands within the dialog and can be folded away again. For an account-specific issue, contact GBMaps with the map type and account email.
Closes the chooser without selecting a payment method. It returns you to the editor or saved-map page. Closing a chooser is different from cancelling a payment after you have already moved into a provider’s checkout.
Manage saved work
Order a printed map
Where Order Print or Poster Print is offered, you can request a physical print of the saved artwork. Prepare the map carefully before ordering.
Open the print action from the row for the version you want. Check the title, date, orientation and artwork before ordering; an older exported PDF does not automatically pick up later edits.
Select the size and other print options shown in the order dialog. The displayed price updates for the current choices. Use the live options and price, rather than relying on a price in this guide’s example image.
Enter the requested contact and delivery information accurately. Check the address and any order notes before continuing. A postcode here is a delivery detail, not a command to move the map.
The order button submits the print-order request/flow shown by the dialog. Read its confirmation and payment instructions. Use the close control to leave the dialog if you only wanted to inspect the options.
Manage saved work
Print order: finish, size & delivery
The print form has two stages. Choosing Continue reveals the delivery fields; Place Order is the submission action. The example uses invented details.
Choose between the offered finishes, currently Glossy Encapsulated Print and 180GSM Paper Poster Print. Use the current form if the range changes. The choice affects the quoted price.
Select A0, A1, A2 or A3 from the current list. The dimensions are shown beside each size. Check that your small text will be readable at that size before ordering.
Enter a whole-number quantity of at least one. The displayed total changes with size, finish and quantity, and the form states whether delivery is included. Review the total before placing the order.
Reveals the delivery section after you have chosen the print options. It does not by itself submit the final order. You can still check the visible options and price.
Complete the required locality, county and postcode fields as requested by this form. Check them before submission; this postcode is the delivery address and has no effect on the map centre.
Submits the print order. Wait for the success message or correct any required-field error. Avoid repeated clicks while the request is in progress. Use the close cross if you do not want to submit an order.
Find your way around
Warnings, confirmations & busy messages
Read the action words on a message before clicking. A colourful warning is there to explain a consequence, not simply to be dismissed. Message styling can vary while the newer design is being tried.
Usually returns you to the current task without taking the proposed leave/delete action. In a draft editor such as Legend details, Cancel also leaves draft changes unapplied. Read the message if it describes a different result.
These confirm an action that removes or replaces work, or leaves unsaved changes behind. Check the named map, layer or territory. Save a copy first when the previous version may still be useful.
Saves the current work before the next action when that option is offered. Wait for saving to finish. If an error appears, do not assume the save completed merely because you clicked the button.
These confirm the result and may offer Download Now, Done or a next action. A file-created message means the export is ready; the browser still needs to download it to your device if you want a local copy.
The tool is working on a save, lookup, import or export. Avoid repeated clicks while it is busy. If the operation fails, note the exact message and return to the relevant settings rather than closing an unsaved map immediately.
The tool uses colourful messages by default. The Messages control lets you change their presentation, and remembers your choice in this browser. Older browsers that cannot display the new dialogs use the original messages. Browser-native warnings may keep the browser’s own appearance.
Useful jobs
Make a clear regional territory map
A practical route from a blank map to a focused regional map for a team or customer.
3. Choose the next zone. Select York team in the legend, then click its shapes on the map. They turn blue; the existing North team shapes remain green. If you click a shape already owned by another zone, you move it into the zone you have selected. After hiding. Hide unassigned areas keeps the assigned territory and the useful detail within it, including relevant place labels and parts of wider boundaries. It hides the surrounding artwork rather than deleting it. Use the same control again to restore the full map.
Use districts or sectors if broad postcode areas cannot describe the territories accurately. Create the team names in START HERE and give them distinct colours.
Click a team’s zone name in the legend, then click inside each map shape you want to colour for that team. Select the next team in the legend before clicking its shapes. Watch Colour: as you zoom. Keep individual district assignments when the whole-area warning appears unless you really intend to replace them.
Turn on the useful labels and boundaries in Map details, then choose Hide unassigned areas. Adjust Regions & Insets if an inset or region is unnecessary for this map.
Add a clear title, arrange the key and add contact details if needed. Resize the key so a person can read it in the final document, not just when zoomed in.
Save a named editable version. Export PDF for print, PNG for a document, or PowerPoint for a presentation. Open the downloaded file and check the edges, labels and key before sharing it.
Useful jobs
Build a map from a territory spreadsheet
This works well when your business already maintains a postcode-to-team list.
Use one row per postcode polygon with its territory name beside it. Remove headings from the copied selection. Check that the postcode level matches the map and that the names are consistent.
Use Import Excel for automatic colours. Use Import with colours if the spreadsheet already contains the desired colour names. Keep all columns aligned.
Compare a few known territories against the spreadsheet. Investigate unexpected extra key entries or blank areas before changing the design. The key should represent the intended groups.
Add a title, make the key readable and choose useful map details. Hide unassigned areas if only the imported territories should be shown. Save with a meaningful name and export the required format.
Useful jobs
Show a depot and its coverage
Choose the method that matches the question: “How far as the crow flies?” and “How far by road?” produce different maps.
Marker boxes on the map. These are placed marker boxes: each label is connected to a location on the map. One uses an arrow with the text above the point; the other uses a line with the text below it. You can change the wording, text size, colours and call-out, and move a selected marker using Place on map. Different dots and shapes. Advanced dots can use circles, squares, triangles, hexagons and stars. Different shapes and colours help distinguish depots, customers or other location types. The larger hollow circle demonstrates a coverage-style outline; the basic dot controls also let you adjust fill, transparency and line appearance. These are example positions. Distance rings on the map. A set of three rings with a 5-mile interval gives radii of 5, 10 and 15 miles from the same centre. The labels and line colours make the distances easy to distinguish. These are straight-line distances, so they are useful for a radius-based service area; use Distance/Time for a journey-based view. Travel areas on the map. Isochrones are travel-area shapes. Their irregular edges show why a time-based catchment can look very different from a circle: the available network affects how far you can travel. This is an illustrative display made with the tool’s renderer, not a calculated route or journey-time estimate. Use Create areas with your own starting location and settings to calculate your map.
Use Radial Circles for fixed distances around the depot. Add sets to compare several depots. Use linked settings when each depot should be measured on the same scale.
Use Distance/Time for road-based travel. Set the outer limit and number of bands, then calculate. Check that the displayed result is useful for the purpose of the map.
Use the corresponding Find postcodes tool, remembering that it tests postcode centres. Review the edge cases before colouring polygons or using the list for operational decisions.
Reference
When the map does not do what you expect
Start with the state of the controls. A hidden layer, the wrong colouring level or an unapplied draft often explains an unexpected result.
Read Colour:. On a detailed map it may be set to whole areas. Switch to the smaller boundary level. If a warning appears, Keep existing colours leaves your detailed work intact.
A placement checkbox is still on. Untick Place centre on map or Place on map when positioning is finished, then select the territory you want to colour.
Move the pointer off the key before scrolling. The key and travel legend deliberately have their own resize behaviour. Use their reset controls if they have become too small or moved out of view.
Check its visibility switch, the region/inset controls and Hide unassigned areas. For imported London locations, check main-map versus inset placement. For a lookup, check the reported successful/missing rows.
The geographic preview has a different background and rendering from the SVG page. Its editing sidebar is intentionally hidden. Go back to Design or Print View to edit, then reopen On Google to refresh it.
Check headings, blank rows, row counts and postcode level. Advanced location settings accept either one shared value or a complete column. Read the exact row/column error and correct the source data.
Check the account email and selected map type. A generated PDF is separate from an editable map. Refresh the file list after a successful save, but keep unsaved work open until you know it has been stored.
Keep the editor open and note the exact error text, chosen format, map type and whether a normal save succeeds. Try again only after the previous attempt has finished. If it persists, contact GBMaps with those details; a console status number alone is less useful than the response message.
Return to Print View and inspect all page edges. Move the artwork, key or annotation inside the page and export again. Design can show artwork outside the final page, which is useful while editing but does not enlarge the download.
Reference
Map words & gesture quick reference
A few terms are used throughout the tool. Knowing the difference helps you choose the right control.
A named group of assigned polygons. The tool uses “zone” in some import fields and “team” in older explanations. The key, also called a legend, tells the reader what those colours mean.
YO is a postcode area; YO18 is a district; YO18 7 is a sector; YO18 7TG is a full postcode. Boundary maps and location tools use these at different levels. A full postcode location is not the same thing as a polygon for every individual address.
A polygon is a map shape that can receive a territory assignment. Its boundary is the line around it; its label is the text naming it. Visibility and colour controls can affect each separately.
Radius is the distance from a centre to a circle’s edge. Interval is the step between successive ring radii. A travel band is one part of a road-distance or travel-time result.
Map: click to colour, drag to move, wheel/pinch to zoom. Key: click a name to select, click a square to recolour, drag a name to reorder vertically, drag the background to move, wheel over a portrait key to resize. Google: drag to pan, wheel/pinch/double-click or +/− to zoom; it does not paint territories.
Hide retains an item for later. Delete removes the named map item or record. Clear text/columns empties an input and may leave existing artwork alone. Cancel in a draft dialog leaves its unapplied changes out of the map. Read the exact control because these are not interchangeable.
About GBMaps & the service
Unlocking maps
Licences, access and what is included. These are the service questions from Help & FAQs. For help with an individual setting, use the illustrated menu topics.
You are paying to use our map customisation tools for this particular map type. You can then import/export/save as pdf or excel and see your map overlaid on a google style map (and much more).
No. We don’t store any payment details so you don’t need to worry. We’ll remind you in 12 months time but that’s it. If you lapse a few weeks it’s no problem, all your maps will still be there. After that, they may be deleted.
No. All our different maps are priced individually. You wouldn’t want to pay a premium to have access to a collection of maps you’ll never use. You find the map you need and you can create as many versions/revisions/copies etc. of that map type as you want.
Unlocking the UK Postcode District map also includes a Postcode Area map licence for 12 months. Unlocking the UK Postcode Sector map includes a Postcode District map licence for 12 months. These are the additional licences offered for those two products; an unlock does not cover every map type.
About GBMaps & the service
Upgrades & refunds
Changing your map type and refund questions. These are the service questions from Help & FAQs. For help with an individual setting, use the illustrated menu topics.
Absolutely you can. People often buy the cheapest map to make sure the site is legitimate and then get in touch to say they really need the more expensive map. Totally understandable and we’re happy for you to do this. Simply buy the map you need and we’ll refund you the original purchase price straight away. (Must be done within a couple of days.)
If you haven’t ‘saved’ any maps, we’re happy to give you a full refund. Once you’ve saved a map it’s possible but unlikely. Each account has a record of activity timestamped into the database so people who buy, create, save, delete then ask for a refund will not be given one.
About GBMaps & the service
Accounts & sharing
Using your licence and managing your account. These are the service questions from Help & FAQs. For help with an individual setting, use the illustrated menu topics.
No. We use some cool A.I. to detect when people are sharing an unlock to create maps. We’ve created a part of the site where you can share your maps with as many people as you like and they don’t need an unlock.
If you email us from your old company email address and request the change then yes. We can’t do it if you don’t have access to the old email address.
About GBMaps & the service
About GBMaps
About the tool and the business. These are the service questions from Help & FAQs. For help with an individual setting, use the illustrated menu topics.
Yes, we’ve been ‘mapping’ and in business for 25+ years. This mapping tool was born 10 years ago and has evolved a huge amount since then. We carry out feature and security updates and maintenance daily.
We have designed the tool to be as accessible as possible for people with no mapping experience and believe it’s better to charge a lot of people a small amount of money rather than a few people a lot of money.
Find it by name
A–Z controls & actions
Jump straight to an explanation. The topic beside each entry tells you where it belongs.