
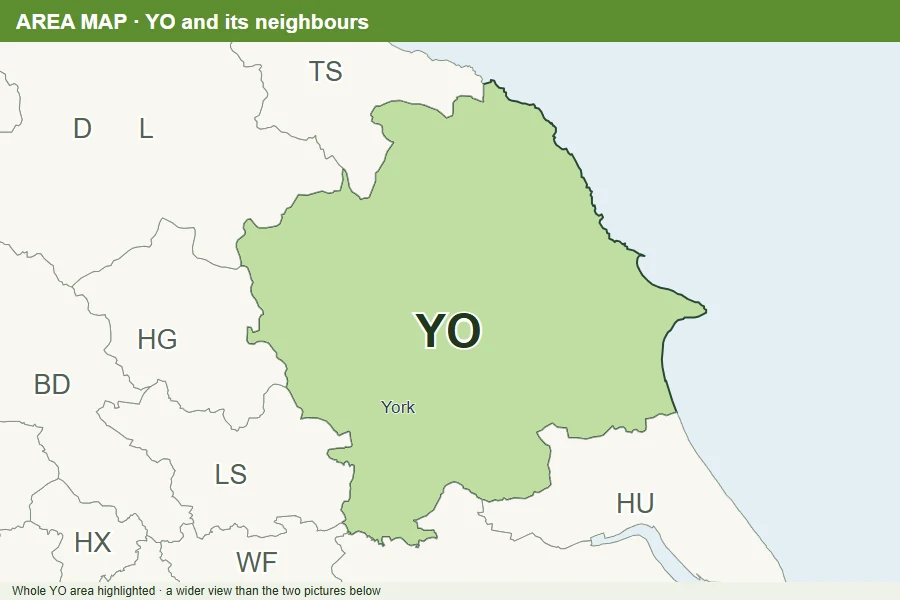
Postcode areas YO
The big picture. Group broad postcode areas into regional sales teams or nationwide coverage.
Try an area map →UK postcode maps, editable vector maps and custom map design
GBMaps online map colouring tools
Create your own postcode and territory maps.
Colour sales areas, plan delivery coverage and turn your figures into a map that makes sense. Add the finishing touches yourself, or tell our AI assistant what you want and let it help with the editing.
Try without an account. Unlock your chosen map to save and download.
Meet your map assistant
You do not have to know which menu to open. Ask the assistant to create territories, change colours, arrange the page or add a note. It works with the map you already have open.
It can do the editing as well as explain it. Read the plan, choose “Make these changes”, then keep the conversation going. Ask for a tweak and it can adjust the same items. Undo is there if you change your mind.
Open the tool & try the assistant See what the assistant can doA conversation could start like this…
“Make the page landscape. Put the map on the left and add a bold text box on the right saying ‘Our sales territories’.”
Then make it your own
“Make North team blue, move the key to the bottom right and make the title bigger.”
Example requests. You stay in control of the changes.
Try 5 AI messages a day as a visitor, or sign in for 20. You choose uploaded files and approve purchases yourself. Read about the assistant and your information.
Start with the right boundaries
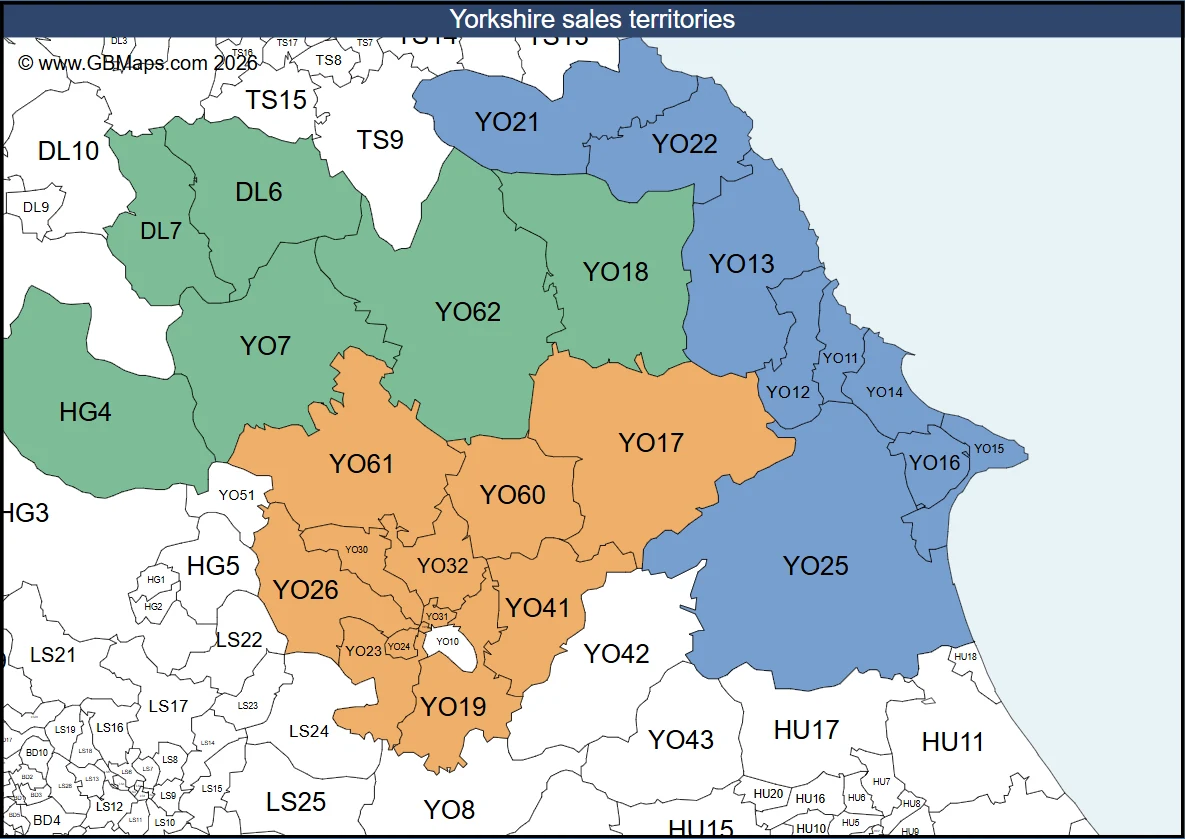
Use broad areas for an overview, or go closer for local territories. See how the YO postcode area breaks down into districts and sectors.
The big picture. Group broad postcode areas into regional sales teams or nationwide coverage.
Try an area map →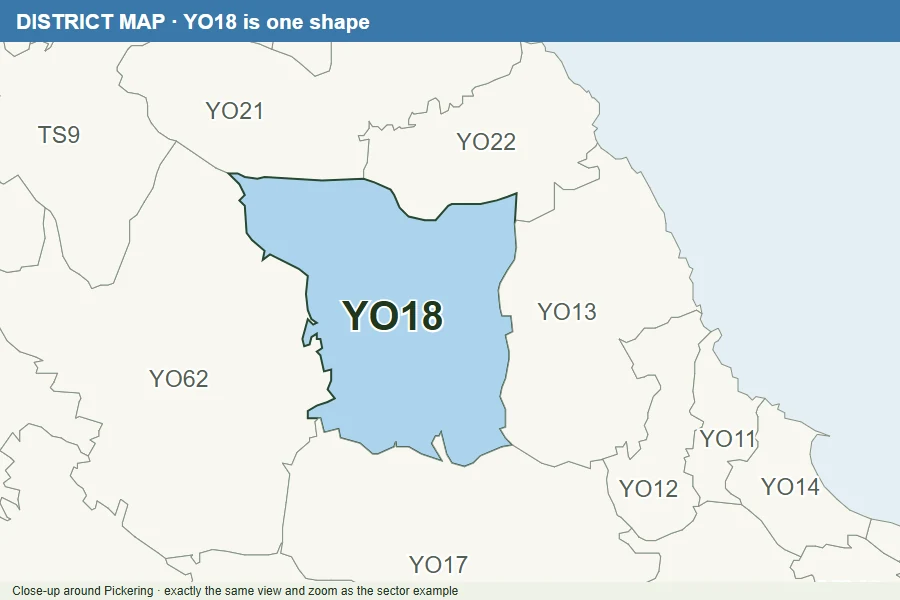
More local control. Build territories around towns and divide larger areas into practical patches.
Try a district map →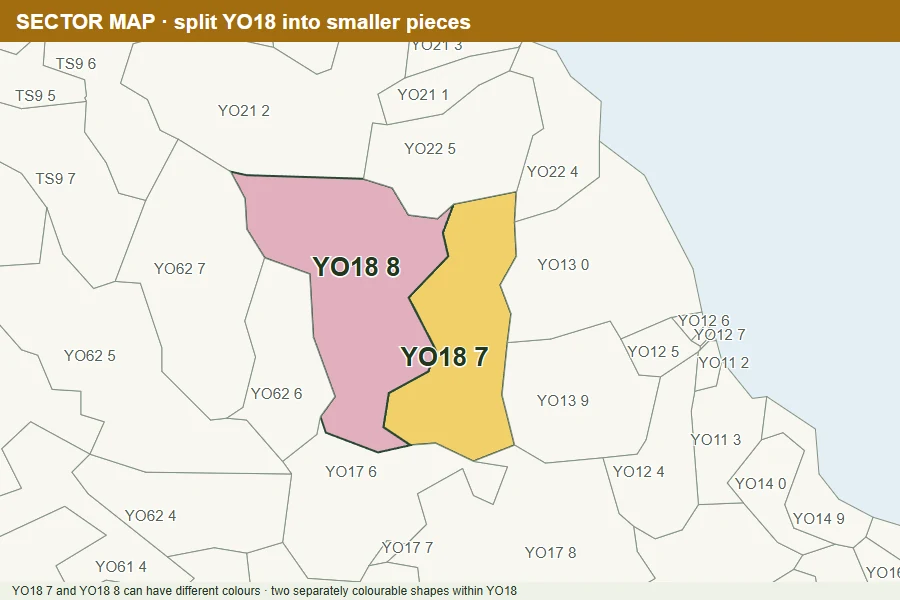
Finer detail. Define smaller delivery zones, local service areas and closely matched territories.
Try a sector map →One postcode, three useful map levels: YO18 7TG area · YO18 7TG district · YO18 7TG sector.
Read the illustrated postcode guide →Try UK counties, Irish Eircodes, NHS boundaries, USA ZIP codes and world countries. Use More Maps in the editor to browse the available boundaries.
Give your figures a place on the map
Already have postcodes, customer counts or sales figures? Make the patterns easier to see, and give each territory a clear purpose.
Bring in a spreadsheet of postcodes or area names with their territory names. Apply your own colours, then refine the map by clicking individual shapes.
How to import territory colours →Shade each boundary by sales, customers, population or another measure. Choose the colour range and how values are grouped. These are coloured areas—also called choropleth maps.
How to colour areas by value →Upload your own figures to Additional Data and show totals for each coloured territory. Save datasets in your account and use them again on other maps.
How to add your own figures →Use your own figures, or data you have permission to use. Statistical data is not included by default with every map. The import tools let you check what matches before you use it.
See what is within reach
Compare delivery zones, service territories or the reach of several depots. Choose the kind of distance that makes sense for your business.
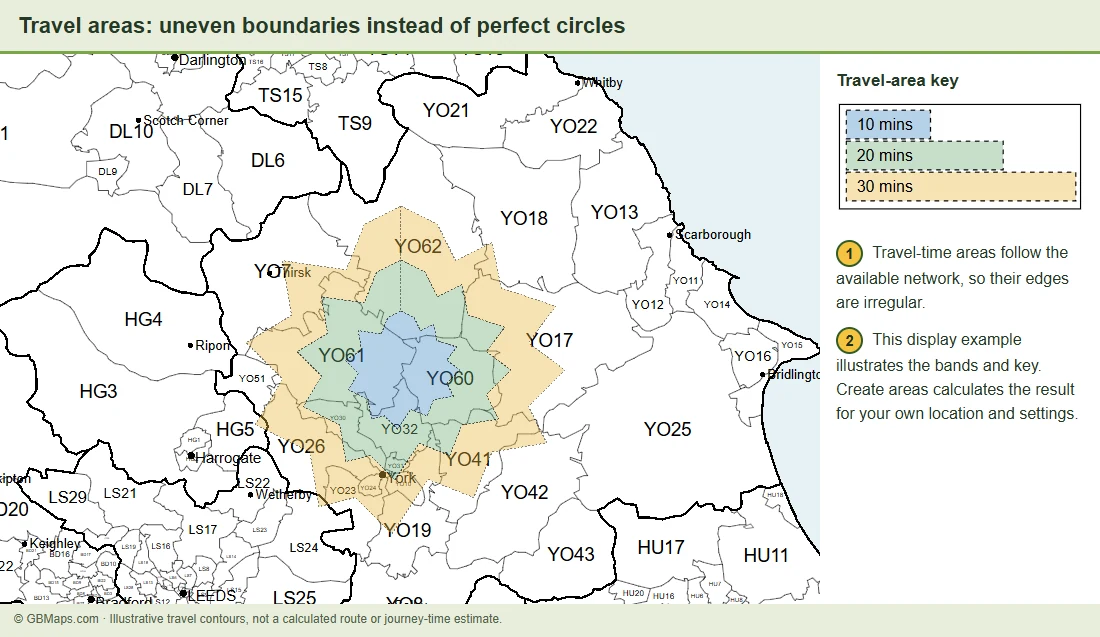
Search for a postcode or place, or drop a flag on the map. Set the distance or time, choose your bands and create the travel areas. Add another starting point to compare locations, with a separate key for each.
Saved maps retain the calculated shapes, colours and keys, so reopening does not calculate them again.
Explore Distance/Time →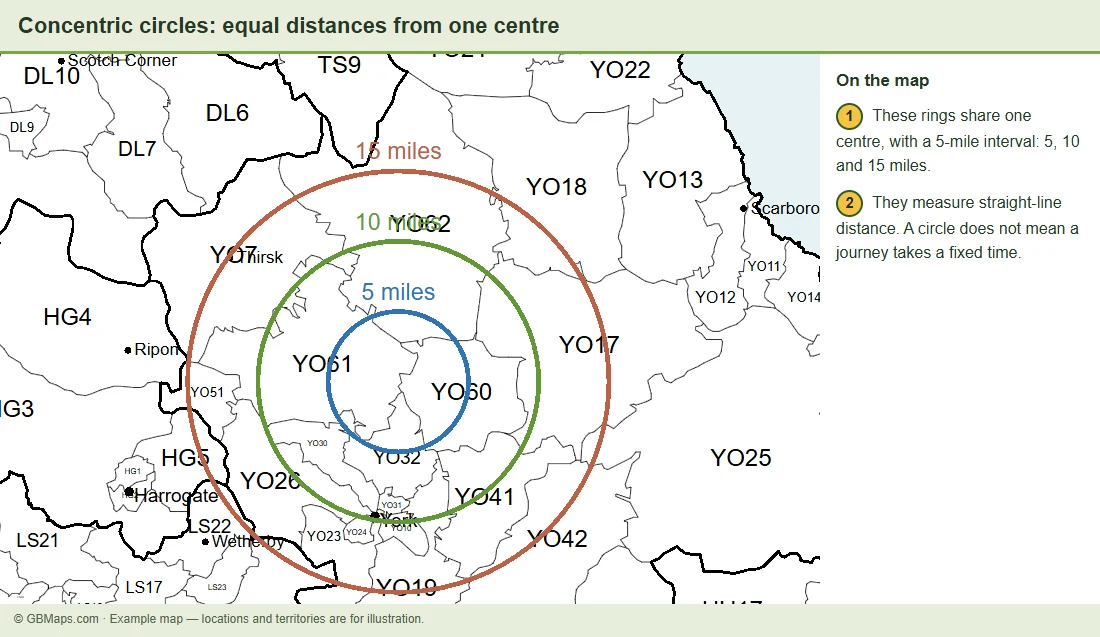
Draw one or more distance rings around a postcode or place. Change their intervals, colours and labels, and use several centres when you need to compare branches or depots.
Colour postcodes turns coverage from circles, travel areas or dots into territories. Keep existing colours or replace them when that is what you need.
Build a coverage map →Travel areas are road-network estimates, not guaranteed journey times. Postcode coverage uses polygon centres, not every address. Route calculations have usage limits.
Make it yours
A useful map also needs to be easy to read. Arrange the page, focus the view and add just enough detail to tell your story.
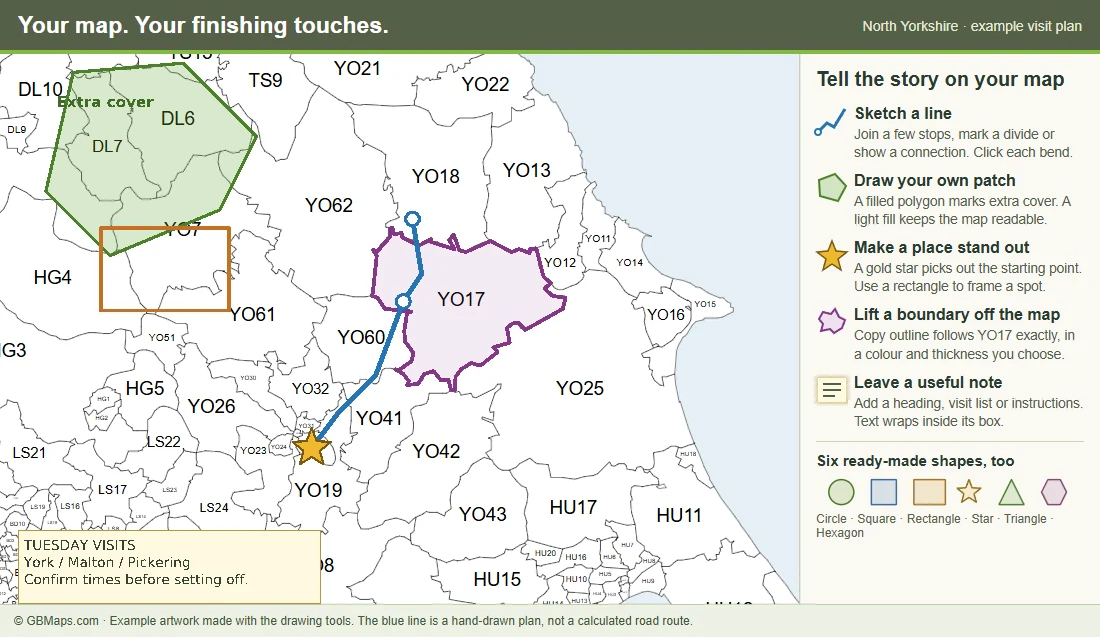
Add a star for a depot, a line between places or a filled polygon to highlight a patch. Draw your own lines point by point, or copy a boundary from the underlying map.
Text boxes give you room for instructions, a visit list or a short explanation, with bold, italic, underline and wrapping text. Keep shapes and notes fixed to the page or attached to the map.
Explore Shapes & Text →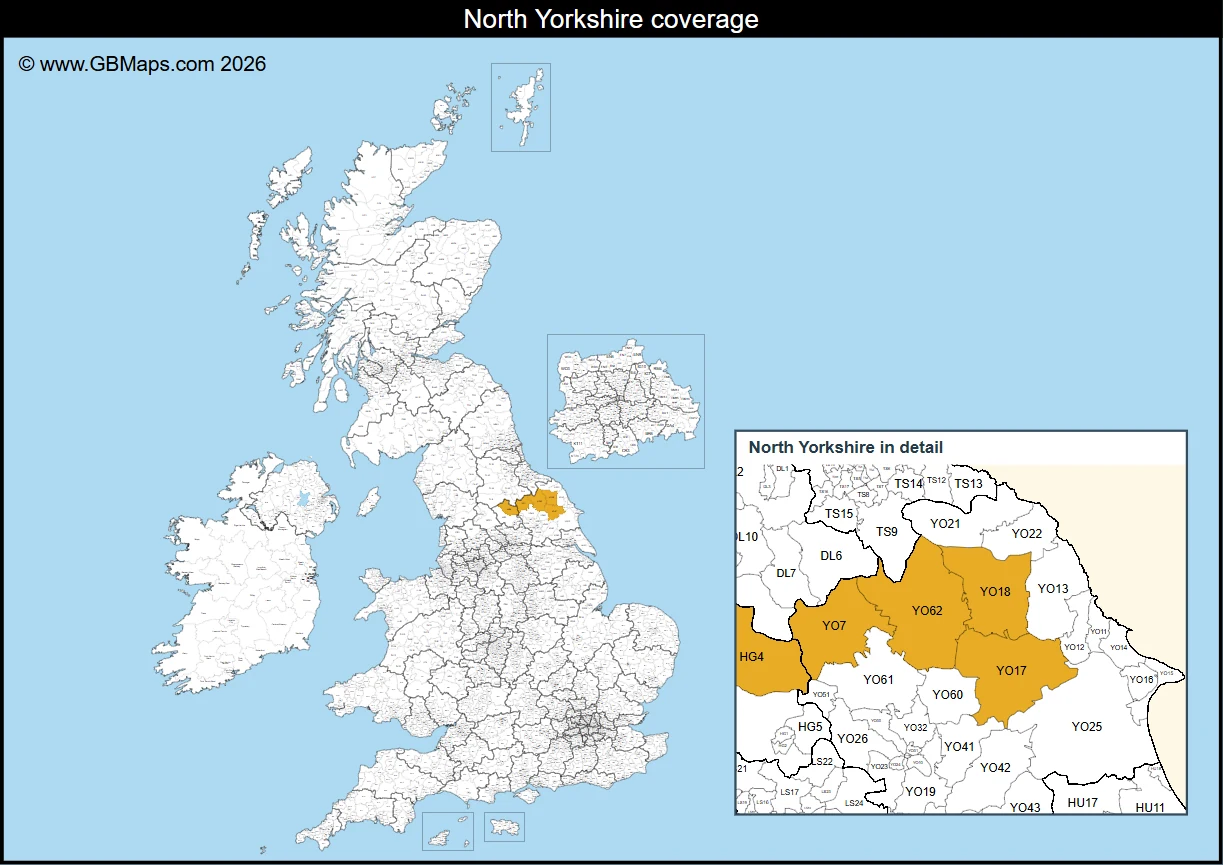
Add an inset to make a busy area easier to read. Pan and zoom it independently, resize it and give it its own background and frame.
An inset of your current map follows your colour changes. You can also use another licensed map in your account; reopening the destination map picks up the source’s latest saved artwork.
Explore inset maps →Add a logo, photograph or illustration. Resize it, adjust the crop and frame, and choose whether it stays on the page or moves with the map.
Add images →Place labelled markers for offices and depots, or import postcode dots to show a list of customers, shops or other locations.
MarkersPostcode dots →Choose portrait, landscape or square. Move and resize the key, add extra legend text, change colours and hide unassigned areas to focus on your territories.
Customise the map key →All in your browser
Work visually with familiar panels for colours, labels, maps and data. Drag, zoom and arrange your page. Use Undo and Redo as you refine it.
For supported map types, On Google opens a geographic preview over a street-map background.
The blue question marks open illustrated instructions for the tool you are using. The assistant can explain a step and show you where to click, as well as make supported edits for you.
Take a look through the handbook →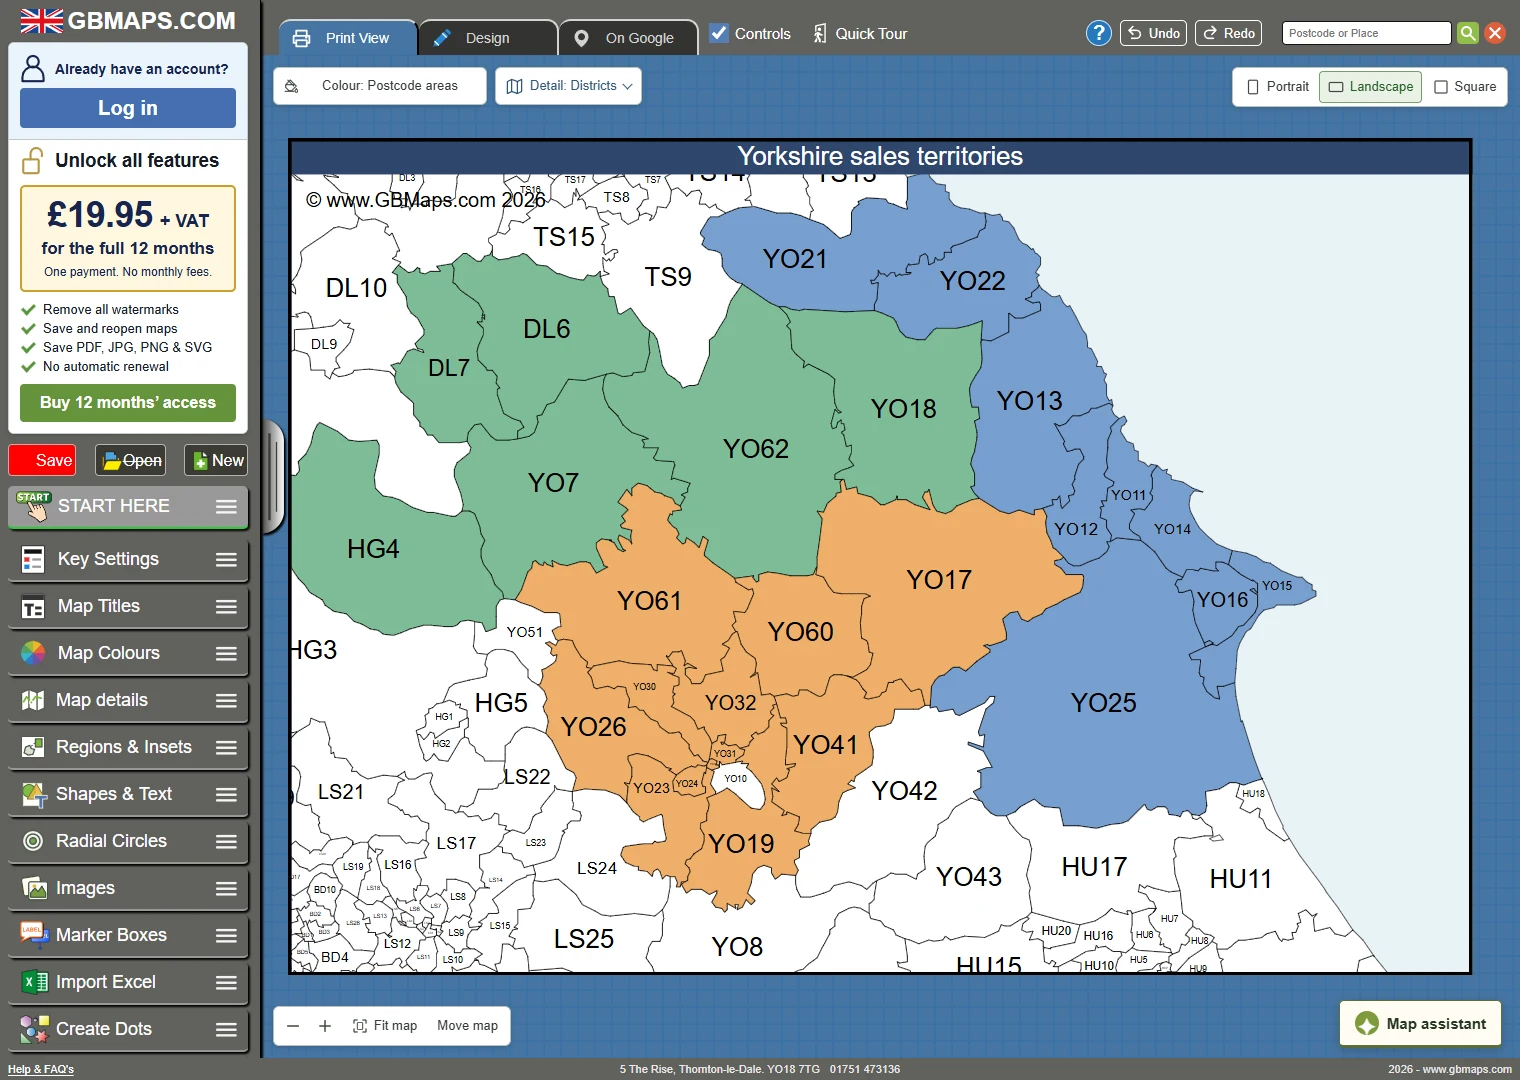
Try first. Unlock when you are ready.
Try the editor before buying. When you are ready to save and download, choose a licence for the map type you need. The displayed price covers 12 months of access, with VAT added where shown.
No automatic renewal. Map prices vary; you see the price for your chosen map before paying. Sign in to save editable versions and make separate copies for different teams or projects.
Before you start
Need a hand choosing a map? Call 01751 473136 or get in touch. We are map designers, and happy to help.
Yes. Open a map and try the editor without creating an account. Trial maps show a watermark. An active licence for your chosen map type is required to save maps to your account and download finished files. The price is shown before you buy.
Yes. In the mapping tool it can propose and apply supported changes to your open map, including territories, colours, titles, layout, shapes, text, markers, circles and insets. Read its plan and choose Make these changes. You can ask for follow-up tweaks or use Undo this job. You still choose uploaded files yourself and approve purchases.
Choose postcode areas such as YO for a broad overview, districts such as YO18 for more local territories, or sectors such as YO18 7 for finer detail. A full postcode such as YO18 7TG identifies a smaller group of delivery points; it is not the same as a sector. Our illustrated postcode guide compares all three map levels.
Yes. Import a list of postcodes or boundary names with territory names to assign your zones. For numerical values such as sales, customers or population, use Heat Maps to group figures into coloured bands. Additional Data can also show totals for your territories in the legend. You supply the figures; statistical datasets are not automatically included with every map.
With the appropriate map access you can export PDF, SVG, PNG and JPG, download a PowerPoint presentation, or export territory data as CSV. PDF is useful for printing and sharing; SVG retains vector artwork for further editing. Save an editable copy in your GBMaps account so you can return to the map later.
No. Radial Circles show straight-line distances from a point. Distance/Time uses the road network to estimate driving distance or travel time. Road-travel estimates are not guaranteed journey times. Colour postcodes selects areas using their polygon centres, rather than testing every address.
No. The displayed map-licence price is a single payment for 12 months of access to that map type, plus VAT where shown. It does not renew automatically. Different map types have different prices, shown before purchase. Renew when you want to continue saving and downloading.
Visitors can try 5 AI messages per day; signed-in users have 20 per day. Follow-up messages count towards the allowance. Availability and service limits apply. The illustrated help pages remain available when your AI allowance is used up.
Start with a map. See where it takes you.
Choose your boundaries, try the tools and ask the assistant to help.